View of load (overload) of a computer through Online information - state for the past 48 hrs
The easiest way to determine load in CM is to use Online Information. They offer data immediately after C-Monitor client's installation, without any configuration. However, they cannot be used to notify overload (that is a job for Watches). Data in Online information are available for C-Monitor client licenses types Standard and Premium, archived for the past 48 hours in 30sec up to 3min intervals, according to the type of license and length of the "long interval" and types of the displayed data are slightly different for different platforms (Windows, Linux/FreeBSD, MacOS).
Skip to :
Entry to view the current (recent) state
Data history to CPU, RAM, HDD in graphs
Load of network cards
Load of CPU+RAM by a concrete process
Load of internet transfers by a specific process/program
View of history in a table form
Annex : List of Online information parameters for different platforms (Windows, Linux/FreeBSD, MacOS)
Entry to view the current (recent) state
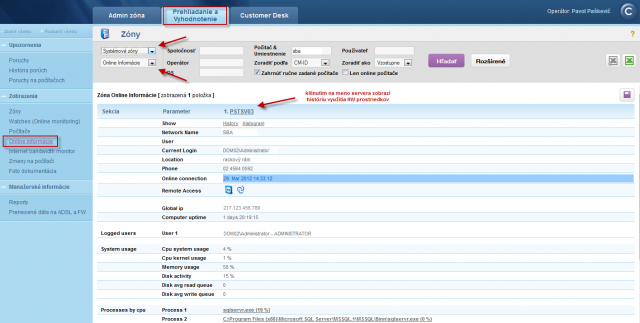
The current state, as well as history for the past 48 hours of usage of the server can be viewed in CM Portal, in the section Presentation and evaluation -> left menu Online information. After clicking on the link History or directly on the computer's CM-ID, the history of Online information will be displayed.
Data history to CPU, RAM, HDD
In a zone's history is defaultly displayed the course for the past 3 hours, the displayed time may also be adjusted. There are transparent graphs showing the standard usage of the Processor (or System), usage of physical RAM, disk activity, average value of waiting requests from the queue to read or write to disk. The graph may as well be printed by clicking on Print graph
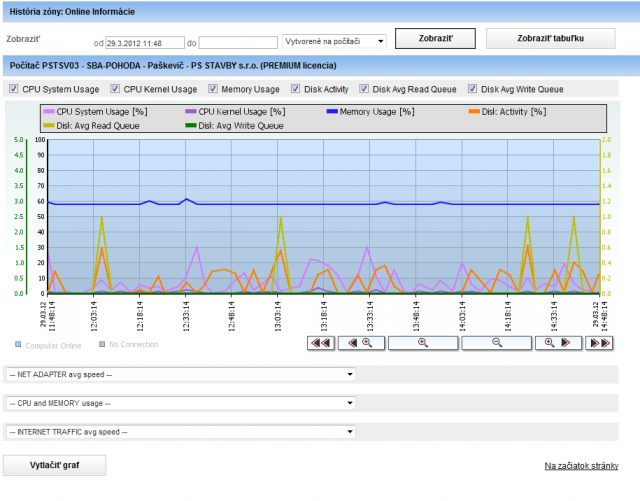
Under the first graph, there's an option to create other graphs. These are for usage of the network card, CPU and RAM, load of internet transfers.
Load of network cards
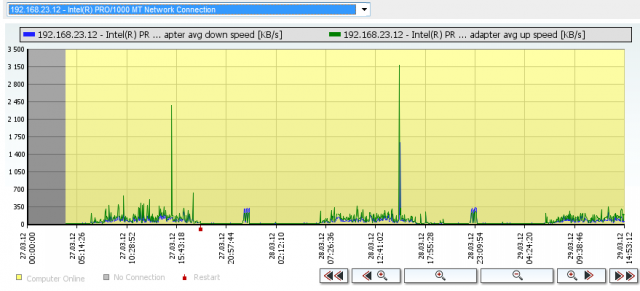
You can either choose the total transfer speed through all network cards, or you just select one.

the result will be a graph with download/upload transfers:
Load of CPU+RAM by a concrete process
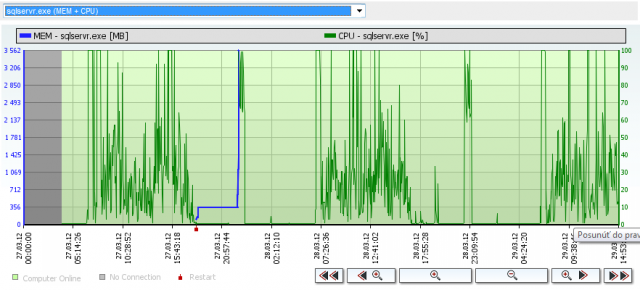
another of the graphs is the one for load of the server's CPU and RAM by a concrete process. Choose the process in the field CPU and Memory usage :
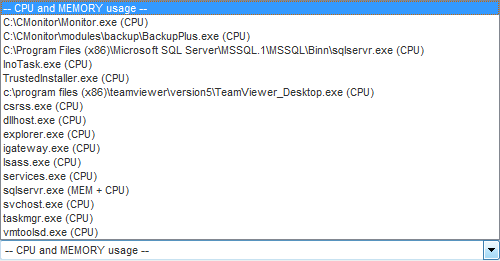
The result will be a graph with history of just the selected process:
Load of internet transfers by a specific process/program
(note : so far available only for WIN32 systems)
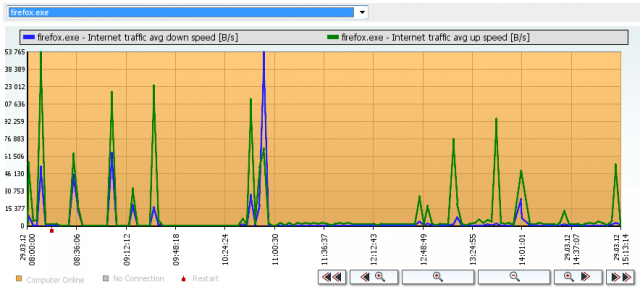
The last graph is history of usage of the internet line by a specific program: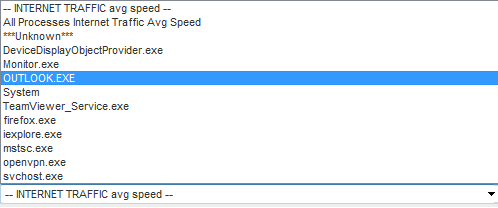
after selecting the concrete program, the result will be a graph of download and upload via this program
View of history in a table form
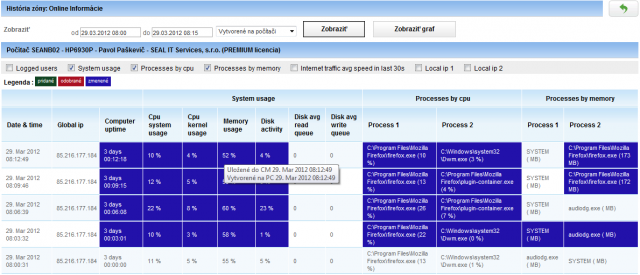
A highly unique feature is the view of Online information in a table form. Each sample is saved to the database with complete data, and therefore you can find out what was the usage of CPU, RAM by the most burdening processes two days ago, as well as what was the public IP address, which local IP addresses were active, transfers on network adapters, what was the internet transfer (note: the data vary according to the type of platform, see the last point of this page).
The view can be switched to table by pressing Show table in the top right section of the screen with history (graphs). To re-display the graph, press Show graph. The table with the values can be exported directly to Excel by clicking on the small excel icon in the top right of the screen.
![]()
The table form view may look something like this (the preview doesn't contain all available data, which are selected in the line above the table's Legend) :
Annex : List of Online information parameters for different platforms (Windows, Linux/FreeBSD, MacOS)
Windows :
Global IP - Public IP address, from which communication from C-Monitor is iniciated
Computer uptime - Uptime of the computer
CPU System usage, CPU Kernel Usage - Loads of the CPU
Processes by CPU - 2 most burdening processes of the processor
Memory usage - Load of the physical RAM
Processes by Memory - 2 most burdening processes of RAM
(note : on 64bit OS the used size is so far not shown in MB)
Disk activity - Average load of all disks in the system in percent
Disk avg read queue - Average number of requests for reading from the disk (Premium license only)
Disk avg write queue - Average number of requests for writing on the disk (Premium license only)
Local IP x - IP addresses of active network adapters, giving the adapter's name, default gateway ...
Avg down speed in last 30s, Avg Up speed in last 30s - upload a download speed of all communication on active network adapters
Internet traffic avg speed in last 30s - upload a download communication speed just on the internet on active network adapters
Linux/FreeBSD
Global IP - Public IP address
Computer uptime - Uptime of the computer
Cpu total usage, Cpu kernel usage - Overall load of CPU, kernel
Load avg 5 min - coefficient of average load, ideally when it's < 1 * number of CPU
Processes by cpu - 2 most burdening processes of the processor
Memory usage - Obsadenie fyzickej RAM
Processes by memory - 2 procesy s najväčším obsadením v RAM
Disk activity - Load of diak in percent to a concrete disk, which was used the most (Disk)
Disk read - reading transfer speed of the most burdened disk (Premium license only)
Disk write - writing transfer speed of the most burdened disk (Premium license only)
Swap usage - usage of the swap space in MB from the total size of swap
Local IP x - IP addresses of active network adapters, giving the adapter's name, default gateway ...
Avg down speed in last 30s, Avg Up speed in last 30s -upload a download speed of all communication on active network adapters
MacOS
Global IP - Public IP address
Computer uptime - Uptime of the computer
Cpu total usage, Cpu kernel usage - Overall load of CPU, kernel
Load avg 5 min - coefficient of average load, ideally when it's < 1 * number of CPU
Processes by cpu - 2 most burdening processes of the processor
Memory usage - Obsadenie fyzickej RAM
Processes by memory - 2 procesy s najväčším obsadením v RAM
Disk activity - Load of diak in percent to a concrete disk, which was used the most (Disk)
Disk read - reading transfer speed of the most burdened disk (Premium license only)
Disk write - writing transfer speed of the most burdened disk (Premium license only)
Swap usage - usage of the swap space in MB from the total size of swap


