MS SQL performance by Performance counters
Basic monitoring of MS SQL servers' performance on Windows OS is realized by performance counters. There's a large number of them, we've selected a few of the most important ones and we also add configuration procedure for monitoring of any custom performance counter.
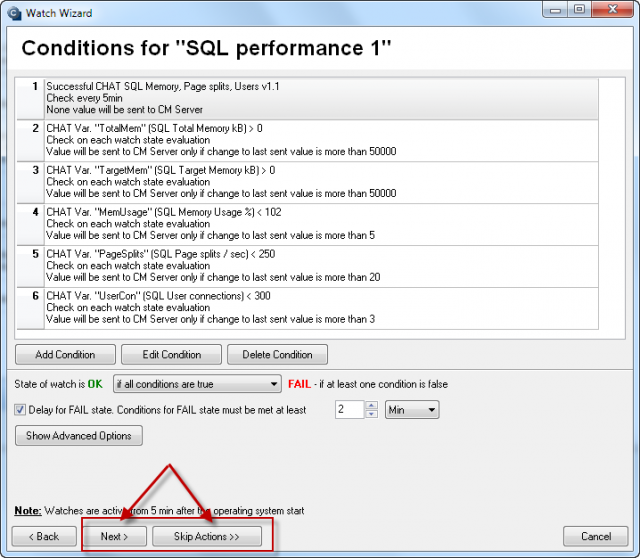
1. SQL Memory, Page splits, users v1.1 (template)
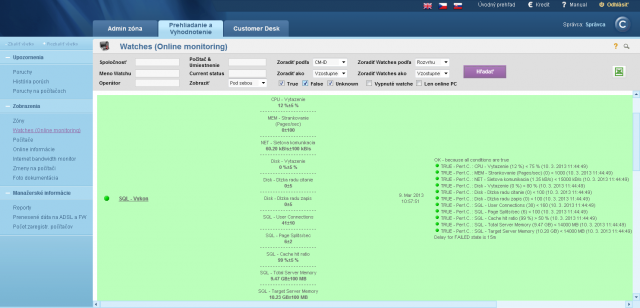
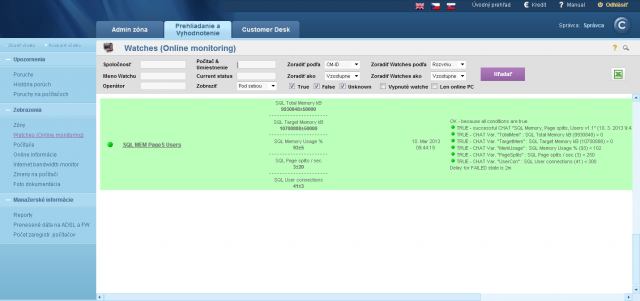
SQL Total Memory - currently used memory by the SQL server (from dedicated RAM)
SQL Target memory - dedicated max. RAM for the SQL server, this value can be found in the Task Manager
SQL Memory Usage % - percentage of the currently used RAM from a target value (if it's near 100%, it means you need to add RAM to the server)
SQL Page splits / sec - it's a specific amount of operations per second at memory management by the SQL server. If the values in cells exceed a certain size, the SQL server must split them among several memory pages - hence the name "Page split". If it happens too often, it slows down the SQL server's operation. (indicatively, even a few dozens for a few GB database is a bad number). This can be removed by maintenance of the SQL server by an SQL specialist
SQL User connections - number of connections to the SQL server, for you to be able to tell if the performance parameters are adequate to number of users
Setup can be found be below in the article
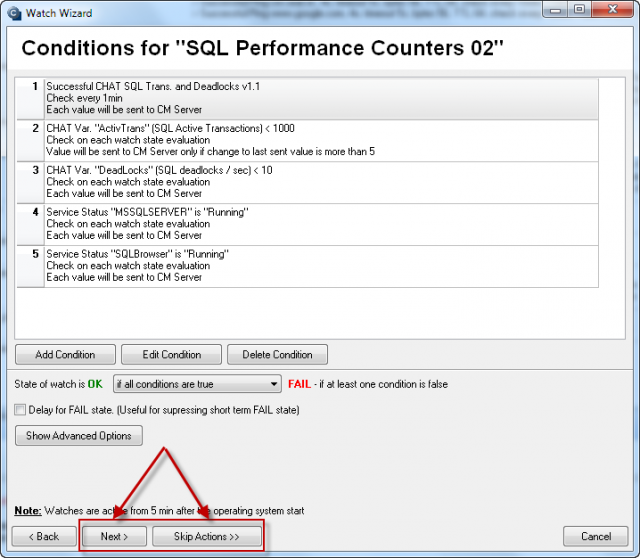
2. SQL Transactions and Deadlocks v1.1. (template)
SQL Active Transactions - one or more changes actively executed in the database at the time of value reading. It's a field, for which you should choose limit values empirically, since it depends on the application.
SQL Deadlocks - deadlock occurs, when two processes try to update the same record or a record file
Setup can be found be below in the article
3. Custom performance counter
It's possible to monitor any other performance counter using the Watch condition Performance counter.
An example of setup is given below in the article
Monitoring setup through templates
Both Watches from the above stated templates are configured directly on the WIN server with SQL server. You must enter its name or instance into the wizard. It's the only parameter that you will enter. Reading of the very performance counters happens directly on OS with the SQL server.
The following images capture the most important setup steps. The others are very similar to other Watches.
1. Setup of Watch through template SQL Memory, Page splits, users
The template is desctribed in introduction of the article, and we only further describe important points of setup .

Name selection for the SQL instance, it's usually SQLSERVER for the first one, and for the other it's usually MSSQL$instance_name.
2. Setup of Watch through template SQL Transactions and Deadlocks
The template is desctribed in introduction of the article, and we only further describe important points of setup .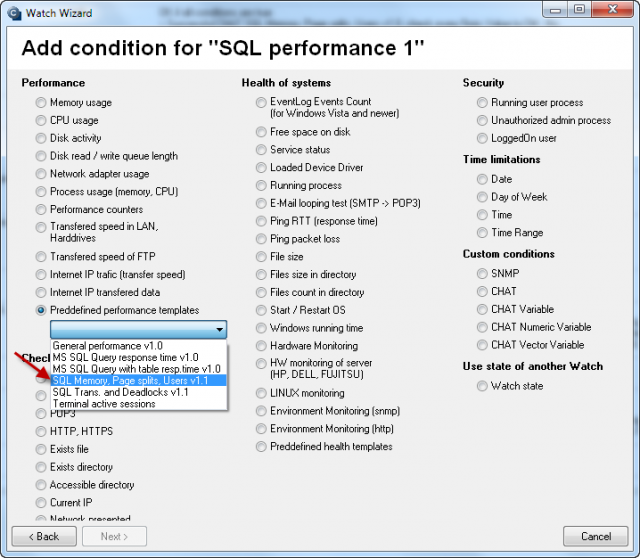

Name selection for the SQL instance, it's usually SQLSERVER for the first one, and for the other it's usually MSSQL$instance_name.
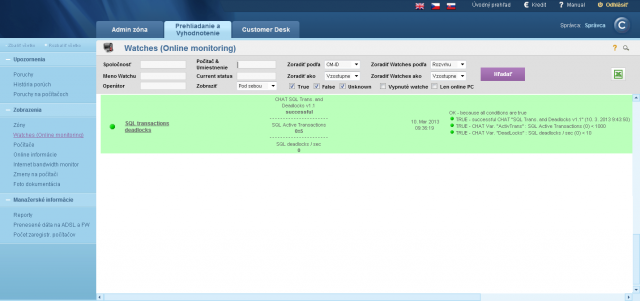
3. Setup of performance counters for monitoring of SQL of custom choice
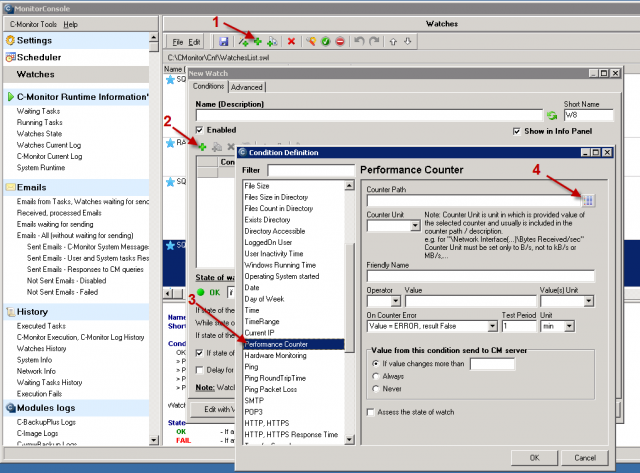
Setup is realized by direct configuration of a Watch without the wizard. After opening the Watch and dialog for adding condition, choose the condition Performance counter. Then find the required Watch. To hepl you find it, we give you a hint that counters for SQL are among other counters, in alphabetical order, starting with name of the SQL instance. For a single or the first instance, it's SQLSERVER, for other instances it's MSSQL$instance_name.
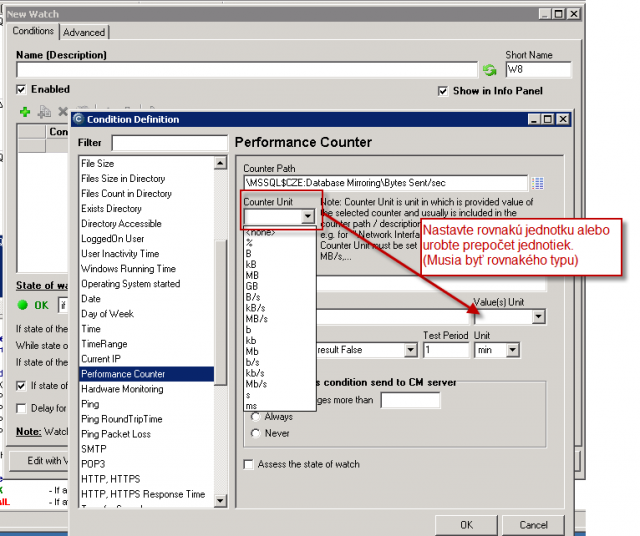
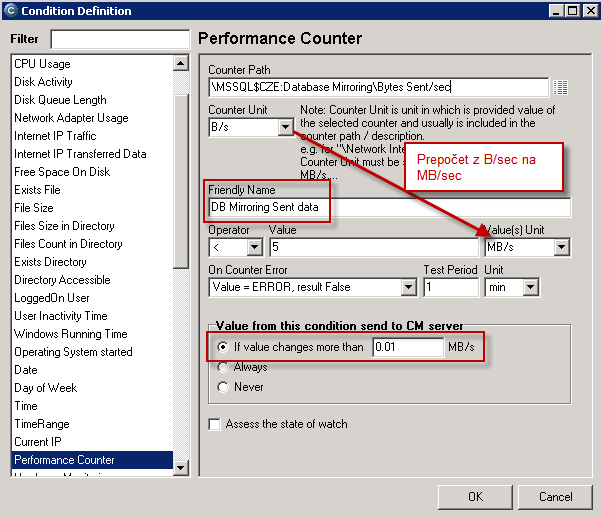
After selection of the counter, you must choose a unit of the expected value. Unfortunately, you must choose it manually, because it cannot be read from the system, it's usually just a part of the counter's description in different forms. On the other hand, you get an option to convert the value from the counter to a more acceptable number (e.g. from high, difficultly read numbers in Bytes, to smaller, easily read MB or GB). Then enter a Friendly name, which will appear on CM Portal, and which you should choose to know what you're monitoring.