MS SQL performance by general parameters
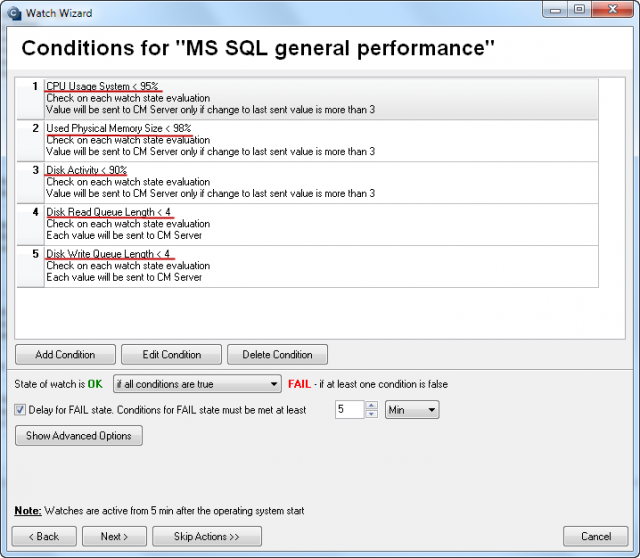
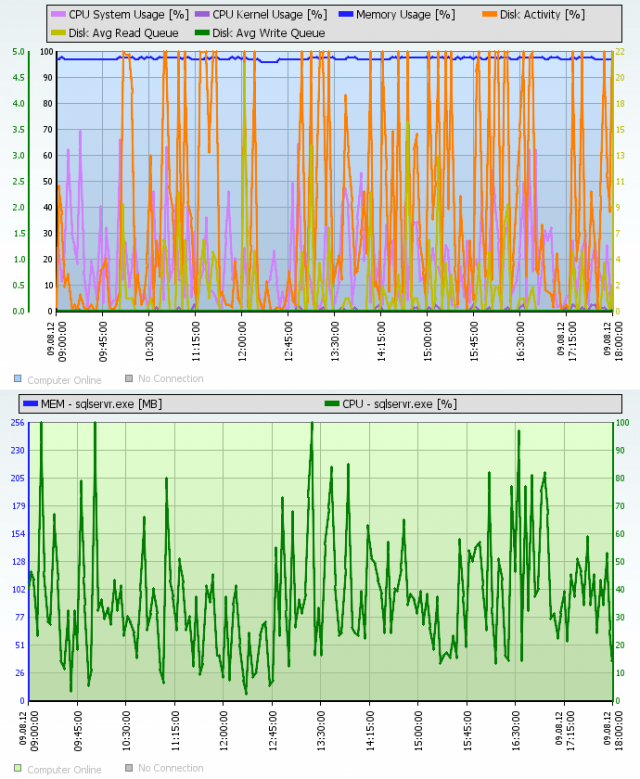
If you use dedicated server for SQL, the first look on the server's status can be found at Online information, which provide history for the past 48 hours, and the Watch from the template General Performance, which provides history for the past 60 days, but mailny informs about eventual overload. The Watch General performace consists of almost the same parameters as are displayed in Online information :
CPU Usage System - it's necessary that there's always some reserve, i.e. that the CPU should rarely reach over 90%
Used Physical Memory - total occupied physical RAM, which is often the maximum for SQL and therefore it's not the main relevant parameter
Disk activity - best reflects overload of the SQL server from the general parameters, if the system is overloaded, this value reaches the upper percents
Disk Avg Read/Write - if the system is overloaded, one of the values is higher than 2. Thanks to this parameter, you can determine if the overload is on the side of reading or writing.
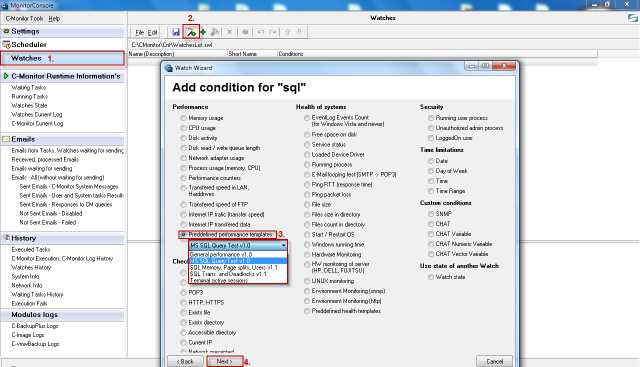
There's a template prepared for the configuration, whose activation is very simple thanks to the wizard in C-Monitor Console in Watches. The procedure is illustrated on the following images.
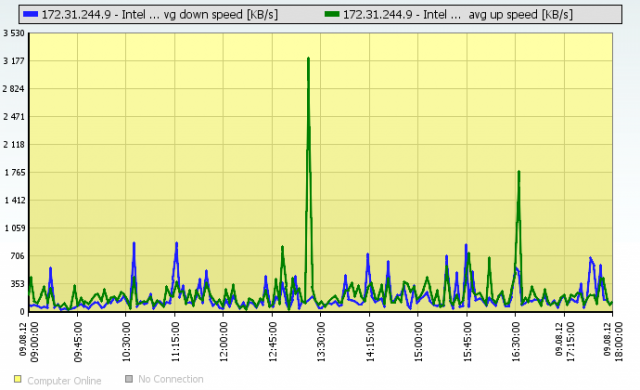
Below you can find illustration images from Online informations for an overloaded state of the SQL server and the state before.
