Overview of Watches Conditions
Watch State
Network Presented
Memory Usage
CPU Usage
Disk Activity
Disk Queue Length
Network Adapter Usage
Internet IP Traffic
Internet IP Transferred Data
Free Space on Disk
Exists File
File Size
File Size in Directory
Files Count in Directory
Exists Directory
Directory Accessible
LoggedOn User
User Inactivity Time
Windows Running Time
Operating System Started
Date
Day of Week
Time
Time Range
Current IP
Performance Counter
Hardware Monitoring
Ping
Ping Round Trip Time
Ping Packer Loss
SMTP
POP3
HTTP, HTTPS
HTTP, HTTPS response time
Transfer Speed
Transfer Speed of FTP
SNMP
Enviroment Monitoring (SNMP)
Enviroment Monitoring (HTTP)
E-Mail Loop Test
EventLog Events Count
Chat
Chat Variable
Chat Numeric Variable
Chat Vector Variable
Service status
Loaded Device Driver
Running Process
Running User Process
Unauthorized Admin Process
Process Usage
Watch state
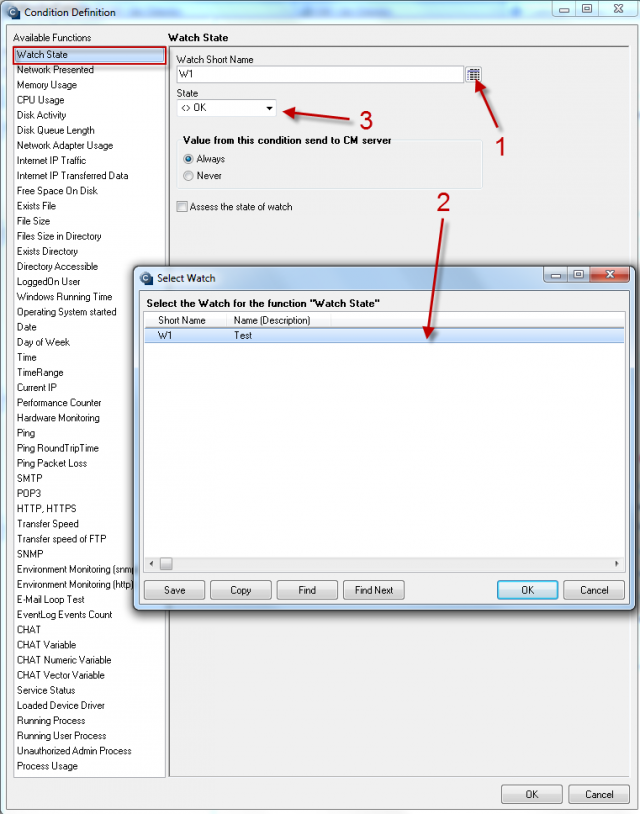
State of Watch is evaluated based on state of another watch. It's often used for a watch, which depends on another one.
For example, Watch 1 monitors availability of internet GW. In watch 2 you want to monitor ping responses on a certain web location and you don't want the watch 2 to enter FAIL state, if the communication to the internet GW ( = watch 1) has failed. Therefore, use the checkbox "assess the state of watch" and choose the required logic for evaluation of the unknown state.
The image describes the simple setup procedure.
In steps 1 and 2, we choose a watch, on whose basis should the new watch be evaluated
In step 3 we choose an appropriate operator for evaluating the watch's state
Network presented
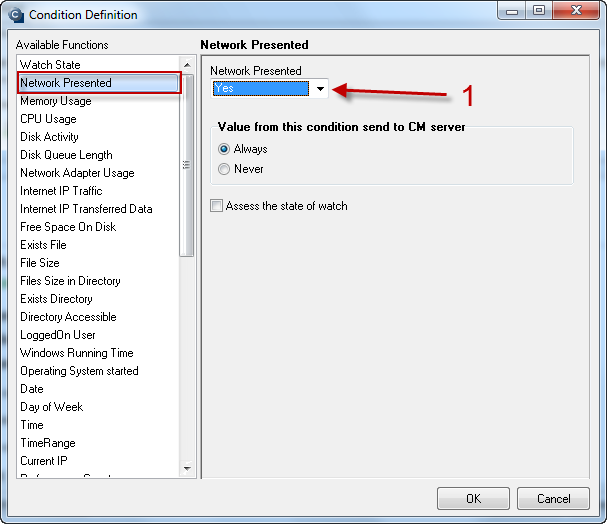
The Watch evaluates presence of network connection based on any network adapter's activity
Memory usage
Monitors usage of the operating memory.
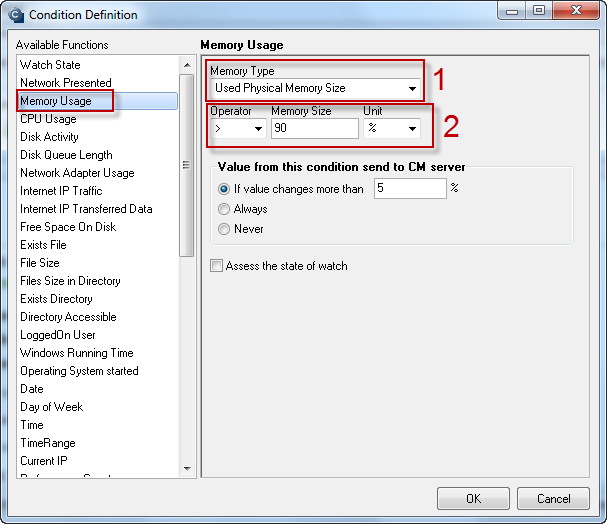
On the image, you can see a typical setup for monitoring of the memory's overload. Although, don't forget to set delay for the false state, so you won't be notified about very little overloads, which might occur frequently.
In step 1, you must choose whether the watch evaluates the state of just physical operating memory, or the state of total system memory = physical + virtual.
In step 2, choose operator, size and unit of the evaluated memory.
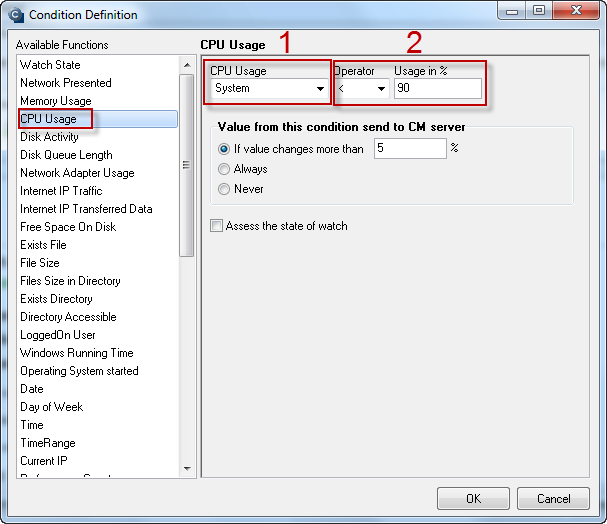
CPU Usage
This condition serves to check of load of the computer's processor. You can choose to monitor either System or Kernel load, what is selected in step 1. The "System" load reflects usage of the very processor, "Kernel" increases mainly at overload of other mediums, such as RAM, HDD.
In step 2, choose a suitable operator and value for the load percentage.
Disk Activity
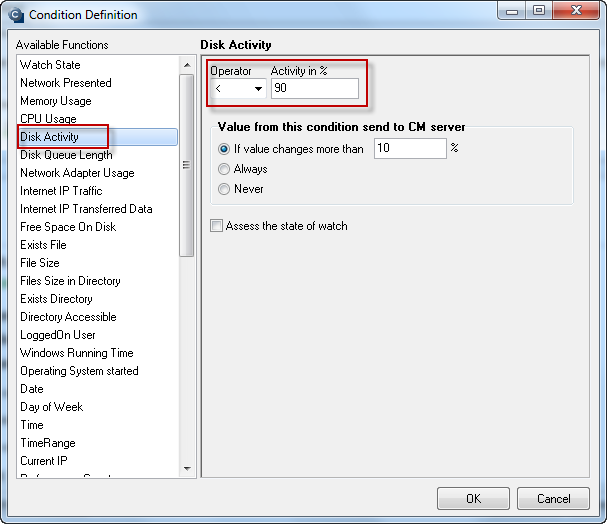
The condition Disk Activity evaluates load of a disk by I / O operations.
Set a suitable operator and percentage value of the usage limitation.
It is also recommended to set delay for false state to a reasonable value (several minutes), so the false state won't occur too often.
Disk Queue Lenght
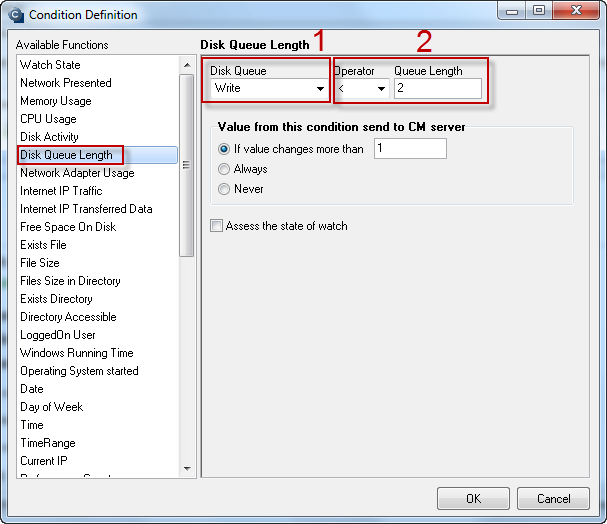
Use this condition to dermine the amount of I / O requests in queue for writing, or reading to disk. Unlike the condition Disk Activity, you can also find out, whether the disk is busy by reading or writing.
The image shows a typical setup for monitoring of the disk's "load" by writing.
Choose between monitoring of writing or reading on the disk in the first step.
In step 2, choose a suitable operator and the amount of waiting operations for writing or reading. If the value 2 is long-term exceeded, the disk "suffers" by overload and its usage is over-dimensioned.
Network Adapter Usage
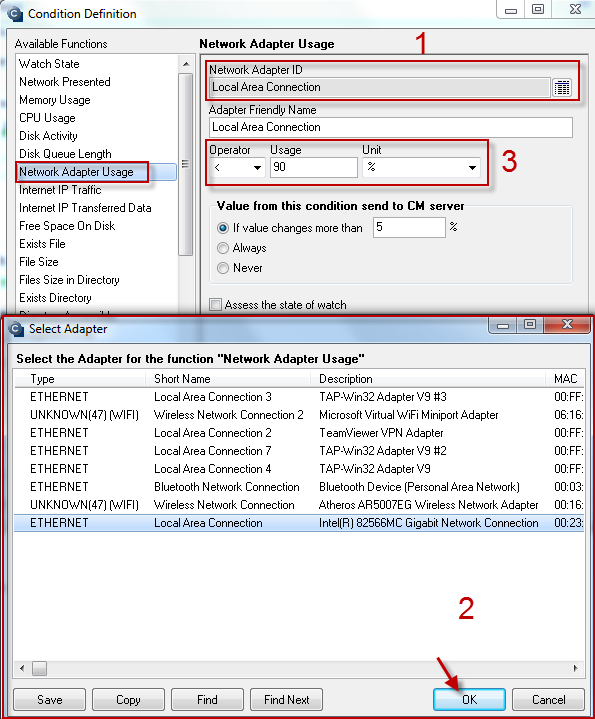
The condition serves to check the load of a network adapter.
On the image, you can see a typical setup for monitoring of usage of network adapter called Local Area Connection for more than 90%.
In steps 1 and 2, choose a network adapter, whose usage you wish to track.
In step 3, choose a suitable operator, value and unit of the usage.
You may choose from the following units:
B/s (total)
KB/s (total)
MB/s (total)
B/s (incoming)
KB/s (incoming)
MB/s (incoming)
B/s (outgoing)
KB/s (outgoing)
MB/s (outgoing)
Internet IP Traffic
With this condition, you can track the current speed of internet transfers.
You can choose to track incoming, outgoing or total communication. Do it in the step 1 showed on the next image.
In step 2, select operator, value, units and hysteresis of the observed variable.
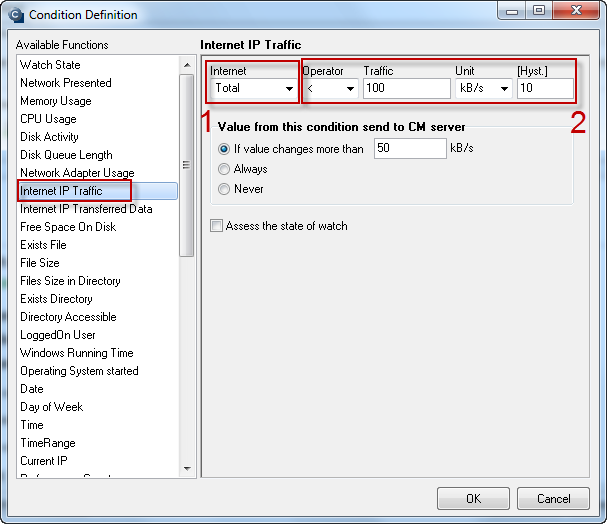
Image: Obrázok: Internet IP Traffic
Internet IP Transferred Data
The condition serves to monitoring of amount of transferred data. You may choose to track total transferred data, submitted and received (step 1). It's also possible to choose different time periods, for which you want the amount of data to be monitored (step 2).
In step 3, choose a suitable operator, amount and unit for evaluation of the condition.
For example, you can set this watch for a user with 1GB prepaid data volume, to notify him that he's exceeded the limit 900MB for this month.
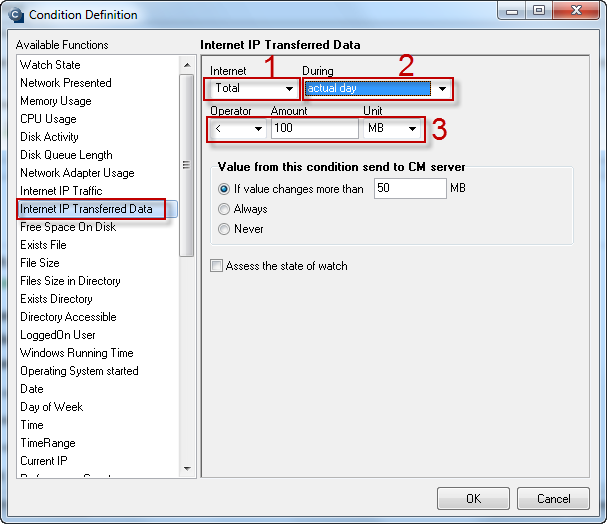
Image: Obrázok: Internet IP Transferred Data
Free space on disk
This condition serves to check empty space on a disk.
Click on the disk icon in step 1 to list out available drives, and select the required one.
In step 2, set a suitable operator and value of the unit, which is set in step 3.
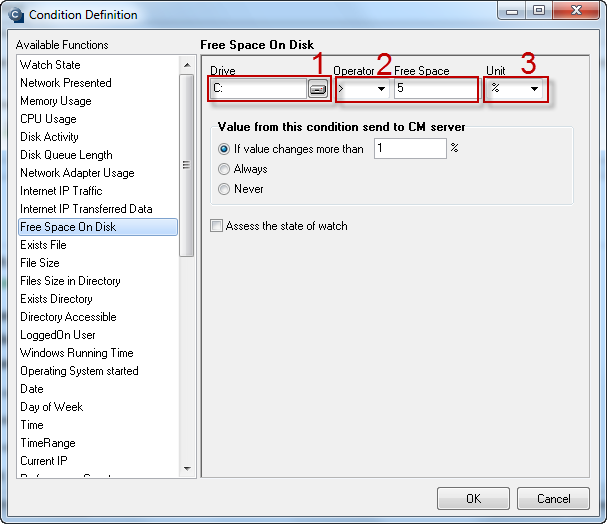
Exists File
This conditition verifies existence of a file.
It comes really handy if you have a program, which generates a certain file in case of an error, and therefore the file's very existence indicates the error. In case you need to react on changes of a certain log file, or even want to receive these changes on email, we recommend the function Getfiles in C-Scheduler
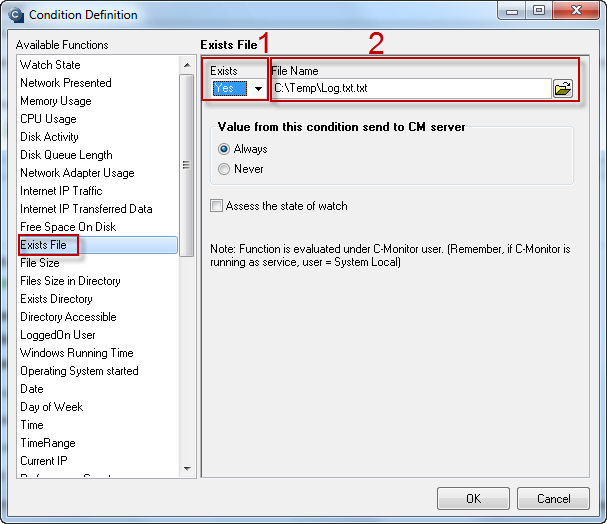
File Size
The condition is used to check the size of a file.
It can be used to track various database files, for which it's important to notify about exceeding some size limit as early as possible. Use it for monitoring of important database files, whose size should be kept under control.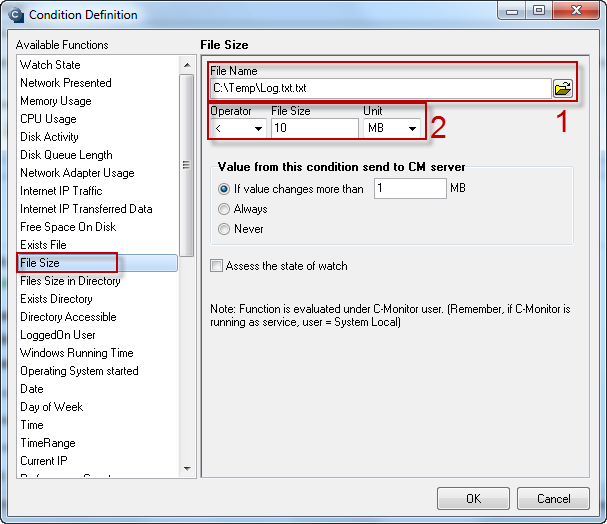
File Size in Directory
The conditions monitors size of files in a defined directory.
It's efficient for monitoring of large amount of files inside one directory, but also in its subdirectories up to the required level, if defined it in the condition.
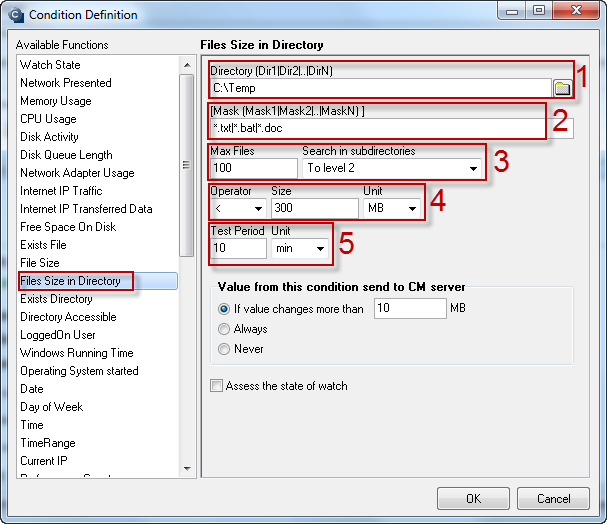
On the following image, you can see an example for setup of monitoring of .txt, .bat and .doc files' size in the directory C:\Temp. The condition is limited to test max 100 files, up to the second level of subdirectories. It's appropriate to set a reasonable limit for every File Size in Directory condition, because if a huge amount of files would appear in the directory for some reason, the condition's execution would extensively load out the disk system.
Step 1 - List out or write down the path to the monitored directory
Step 2 - Choose mask of the files that should be monitored. If you leave this filed blank, all files in the
irecory will be monitored.
Step 3 - Set maximum number of monitored files and the level of subdirectories which should be monitored.
Step 4 - Choose a suitable operator, limit size and unit for the files
Step 5 - Execution of this condition will cause load of the disk system based on the amount of monitored files, so choose a suitable period of the condition's execution.
Files Count in Directory
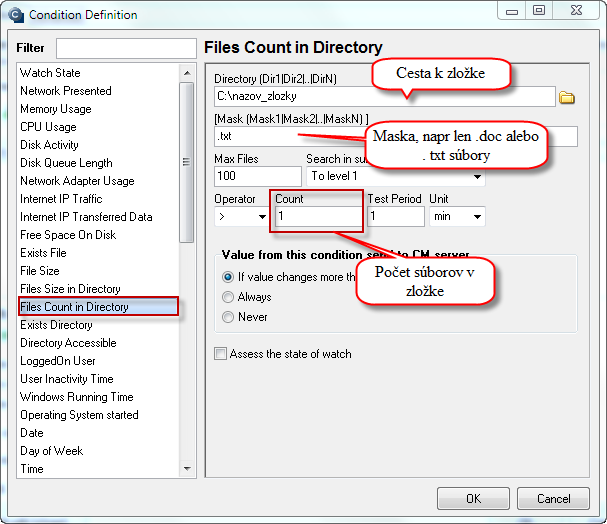
The condition serves to count files inside a directory, you can use it, for instance, to detect presence of the log file of some program's activity etc. On the image is an example, where .txt files are counted in the target directory, and the condition is set so that there must be less than one present, therefore any, as the .txt file will only be created after a faulty program operation, and that's when the Watch is switched to FAIL state.
Exists Directory
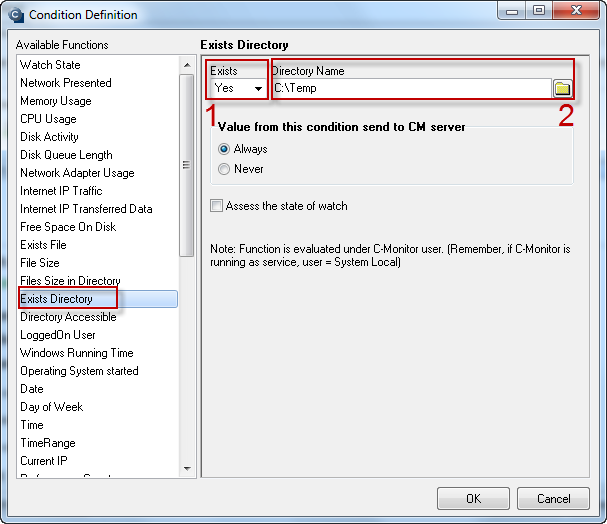
The condition serves to verify the existence of a directory, while it doesn't need access to it.
In the first step, choose if you want to monitor existence, ro non-existence of the directory.
In step 2, list the directory out, or write the path to it.
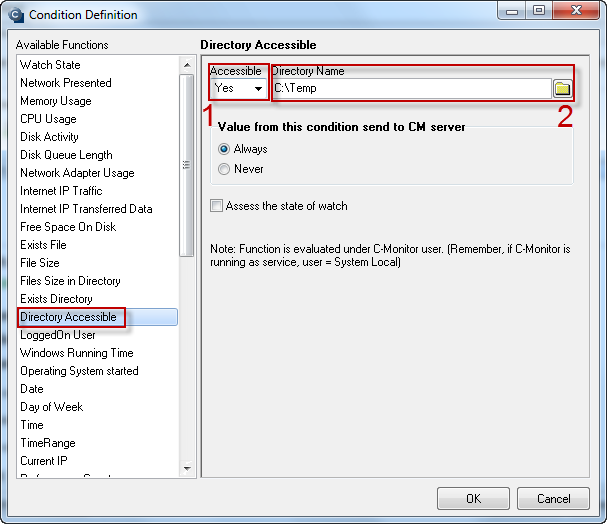
Directory Accessible
With this condition, you can track availability - unavailability of a directory.
The access is evaluated under the same account as C-Monitor is running = if C-Monitor is only ran as service, it's a local system account.
LoggedOn User
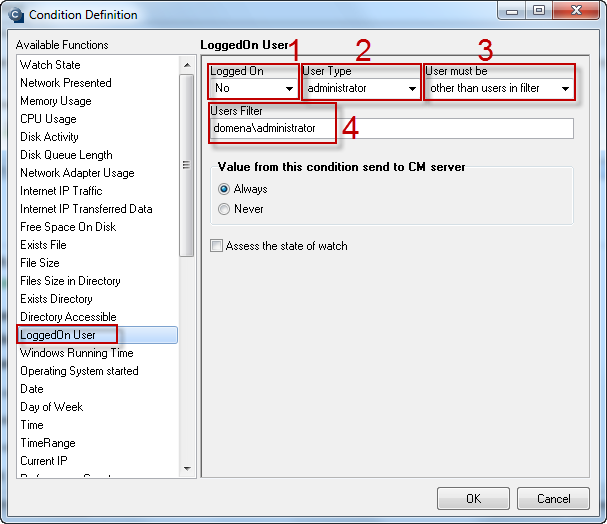
This condition was primarily developed to track down login of an unauthorized admin to the computer, as for work stations with windows operating systems, it's not too hard to break the local admin's password. The technicians agree to only use domain accounts, which are defined in this condition. Other logins under admin authorizations will result to Fail state of this condition.
The image shows setup of the above example, where state OK will only be evaluated after login of the domain admin domena\administrator.
The condition may of course be used for other situations, such as login of a particular user etc.
User Inactivity Time
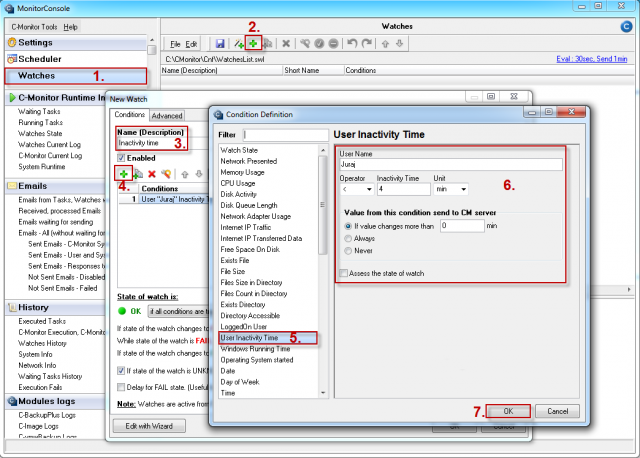
This condition is intended for monitoring of a user's inactivity. If a user is inactive, it means he hasn't clicked the keyboard, or the mouse, resp. hasn't moved the mouse for a defined time interval. The course of this condition may be viewed as a transparent graph for a selected period. For setup of this condition, choose a time interval, e.g. 4 minutes, and when it's exceeded, the Watch is switched to the fail state, which means that the user is currently not using the PC for more than 4 minutes. The setup is showed on the image below. By hovering the cursor on names of the fields, you'll see a hint. The image shows an example of monitoring inactivity of user Juraj, which is switched to the fail state, if the user is not active for more than 4 minutes.
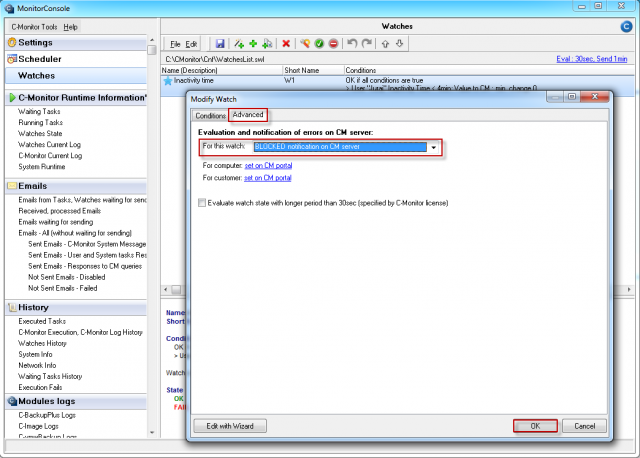
In the tab Advanced, we recommend to block notification to CM server, you'll prevent sending of vast amount of emails about change of this Watch, although the Watch will still be evaluated, and its values recorded.
The current state of watch with information about duration of the user's inactivity, is displayed on the next image.
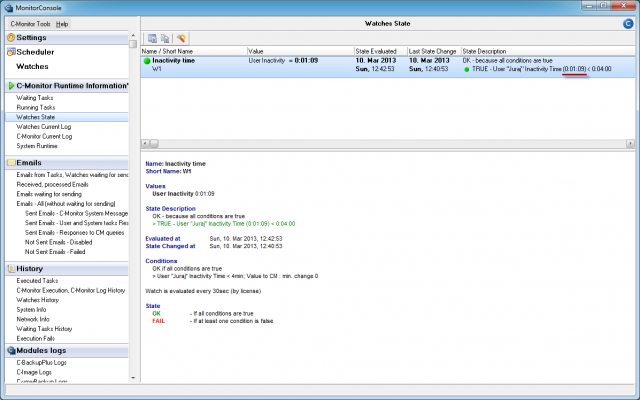
Image: Zobrazenie aktuálneho stavu Watchu
Watch created by this condition reads out the running time of the operating system since the last start.
Thanks to this watch, you can for example receive notification about start / restart of the operating sytem.
At the watch's creation, you must choose a suitable operator and time since start of the OS. Usually, this value is in the range between 5 and 10 minutes.
Appropriate value for change of notification to CM server prevents repeated informing about the same start / restart of the operating system.
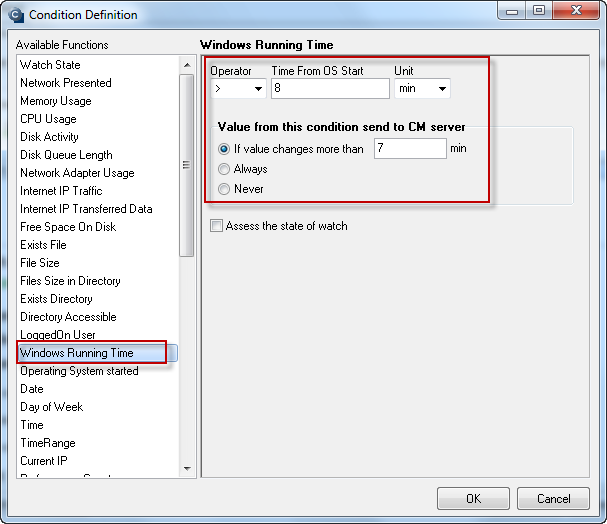
Image: Obrázok: Windows running time
Similarly to the previous condition, the condition operating system started serves to track start / restart of the operating system.
The image shows an example suitable for notification about start / restart of the OS in most cases.
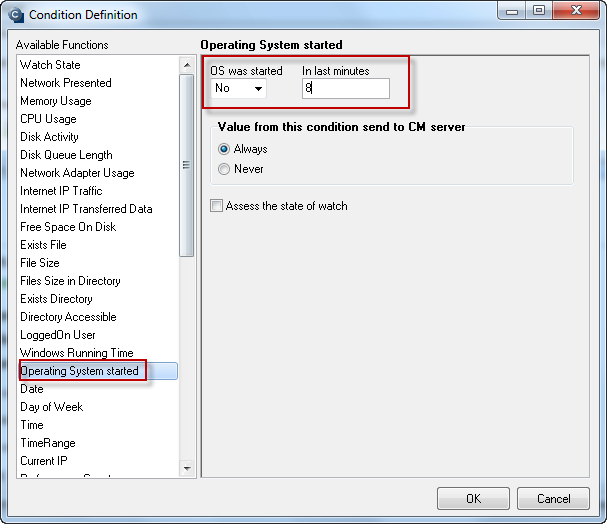
Image: Obrázok: Operating system started
This condition is mostly used as a support condition for watch evaluation, where its state depends on the date.
The condition may be defined with various operators, such as >; <; =; <>;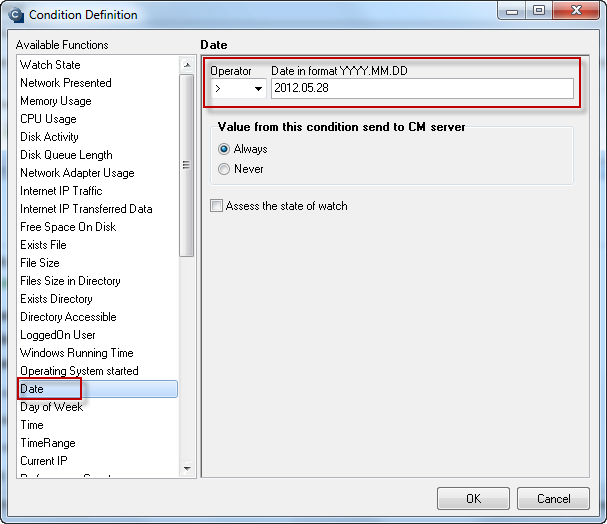
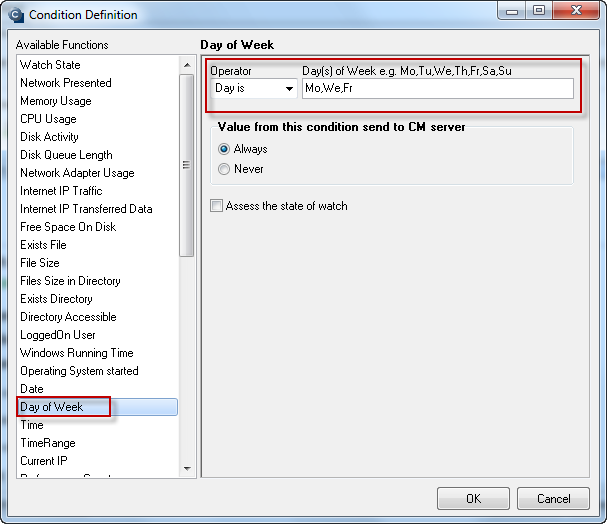
Day of week
The condition compares the current day, according to system time, with value set in this condition, and evaluates it according to the set operator.
The condition can be used for instance as a support condition for watch evaluation only on selected days. Therefore, on other days will the watch be evaluated as "unknown"
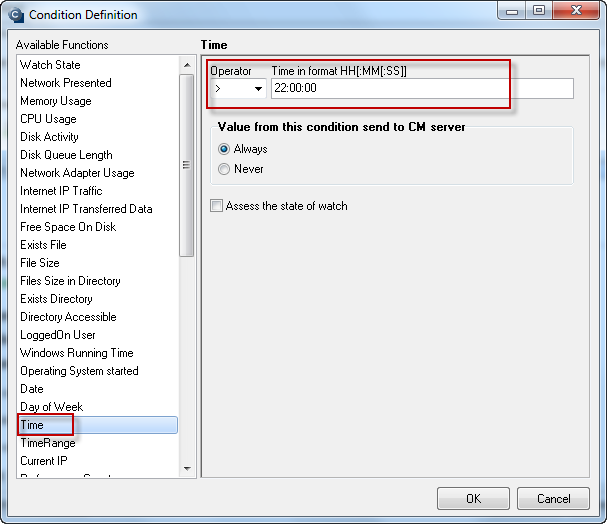
Time
Time is a condition for evaluation of watch according to the current system time.
You may choose from the logical operators >; <; <>; =;
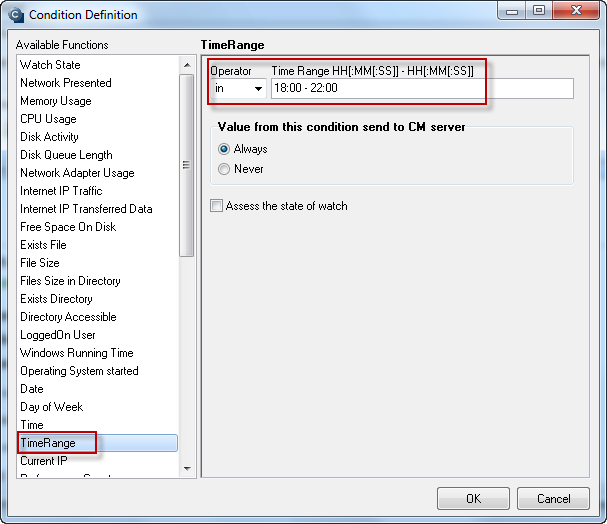
Time range
With this condition, define a time scale, which you want to be used at evaluation of the watch.
For example, you want a watch, which monitors quality of internet connection, to be evaluated only in the defined range of time. Outside the time range, the watch will be evaluated by "Assess the state of watch" as unknown.
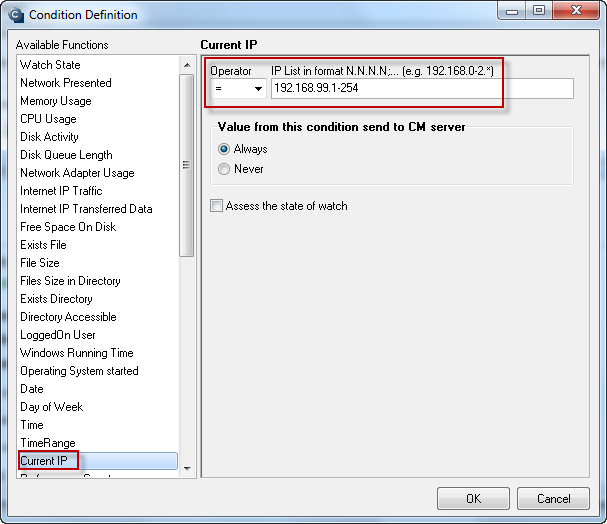
Current IP
This condition reads the currently assigned ip addresses on network adapters, and compares them with the ip address, or range of IPs set in the condition
Performance counter
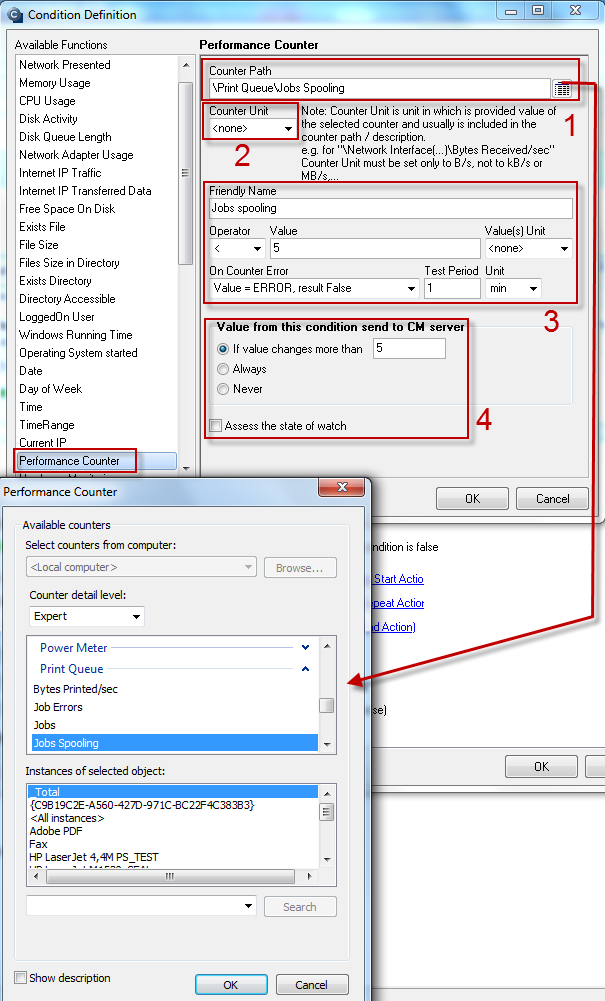
Performance counter serves to reading of all important information from system counters. It offers a lot of different counters, which the CM condition will find in the system.
On the image, you can see an example of setup for a Counter, which tracks the print queue, in which if there's more than 5 documents, the condition will switch to false state.
This setting can be used for a pint server, where it's very important to monitor whether the print queue is not overfilled, what would indicate a possible problem with the printing service.
Hardware Monitoring
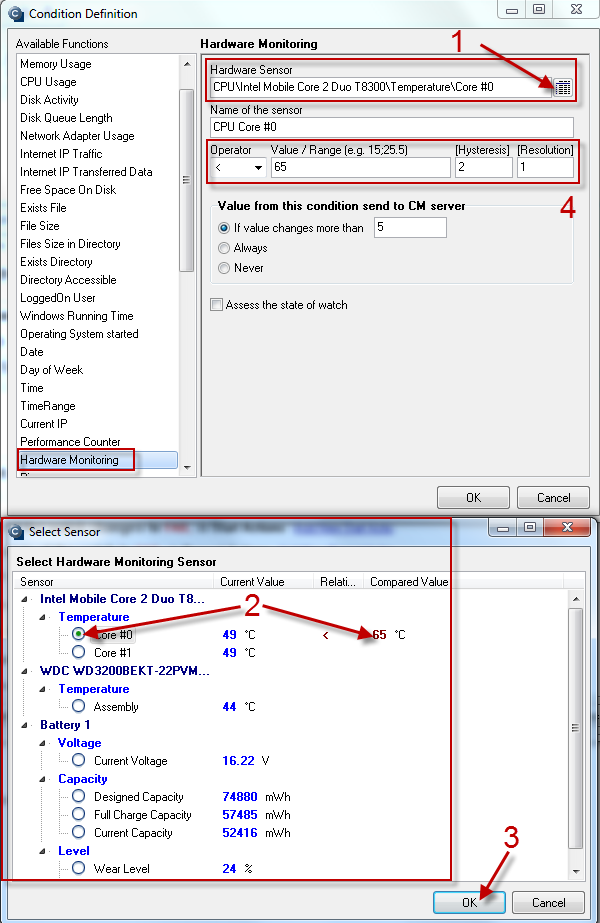
Hardware monitoring monitors parameters of sensors, which can be read on the operating system level. For virtualized operating systems, it's necessary to use reading through SNMP.
Sensors can be found on most standard hardware.
The following image shows an example of setup of the Hardware Monitoring condition, to track the temperature of one of CPU's cores.
CM is able to find all available sensors, which is done in step 1 - click on the icon to view the list.
CM will show you all detected sensors, from which you choose the one you wish to monitor - step 2.
Each sensor needs to have its own condition to be monitored.
Step 4 has to be adjusted individually according to the monitored HW's demands. It's good to choose a suitable hysteresis (limit, in which if the value moves even after exceeding the value of Value/Range, the watch's state won't change) and resolution (resolution of rounding of the value - you can also round to more decimal places, e.g. by entering 0.01), so there won't be frequent changes of the condition's evaluation.
Ping
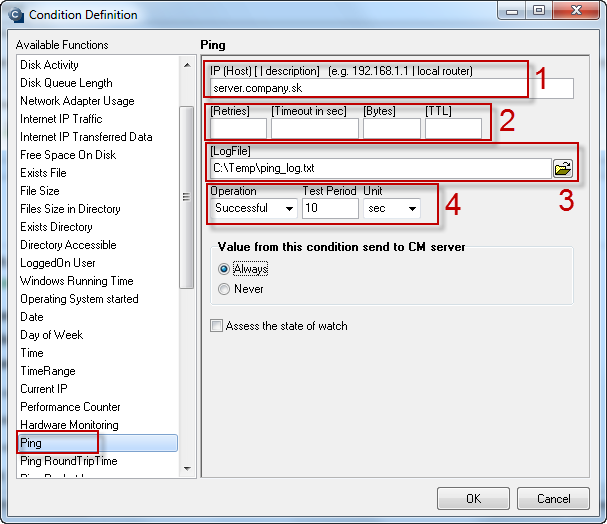
Through condition ping, you can check availability of any IP address or DNS name using icmp packets.
The following image shows testing of availablitiy of server.company.sk - step 1.
In step 2 you can adjust parameters of the testing packet. The fields are defaultly blank and they don't need to be filled, if you wish to keep the default values (Retries = 4, Timeout in sec = 5, Bytes = 64, TTL = 64).
The results of the availability tests via ping can be logged into a file, which is set in step 3.
Step 4 defines the expected result of the operation, testing period and its unit.
Ping Round Trip Time
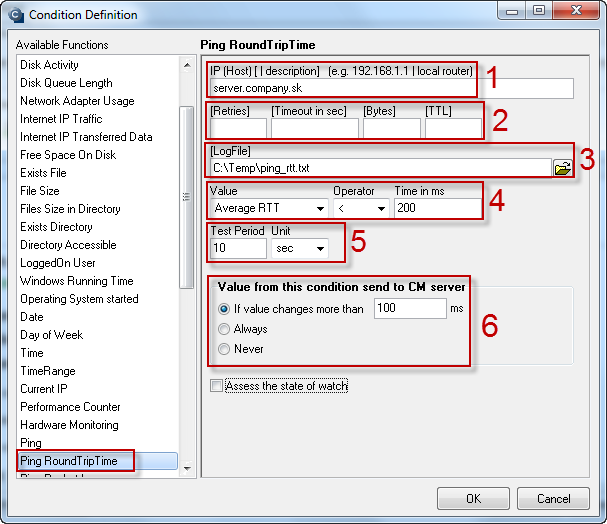
The condition Ping RTT serves to monitoring of time since sending till reception of the packet by the tested target. Compared to testing by Ping, this condition also provides information about delayed reception of the packet.
The image shows setup of the condition to test Ping RTT on server.company.sk.
IP address, or DNS name of the tested target is set in step 1.
In step 2, you can adjust parameters of the testing packet. The fields are defaultly blank and they don't need to be filled, if you wish to keep the default values (Retries = 4, Timeout in sec = 5, Bytes = 64, TTL = 64).
The results of the availability tests via ping RTT can be logged into a file, which is set in step 3.
In step 4, set if you want to monitor Average RTT, Min RTT or Max RTT, suitable operator and time in miliseconds, with which you want to compare the testing sample.
Step 5 defines the period and unit for testing.
Enter a convenient value for notification of this condition's value to CM server in step 6.
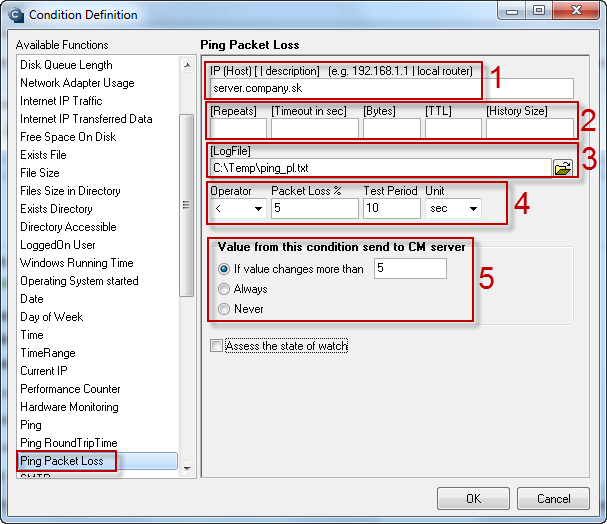
Ping Packet Loss
This condition is used to detect losses of packets on a line.
You can test any reachable IP address or DNS name.
The image shows setup of the condition to test Ping Packet Loss at server.company.sk.
The IP address or DNS name is set in step 1.
In step 2, you can adjust parameters of the testing packet. The fields are defaultly blank and they don't need to be filled, if you wish to keep the default values (Retries = 4, Timeout in sec = 5, Bytes = 64, TTL = 64).
The results of the availability tests via Ping Packet Loss can be logged into a file, which is set in step 3.
In step 4, choose a suitable operator, value of packet loss, with which the testing sample will be compared, time and unit of the testing period.
Enter a convenient value for notification of this condition's value to CM server in step 5.
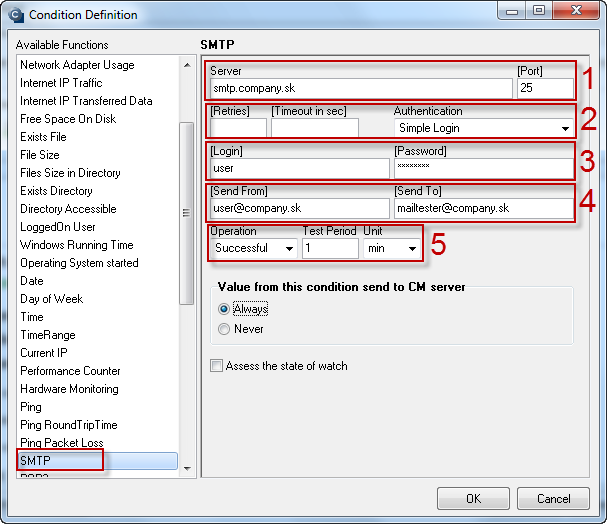
SMTP
The condition serves to check the basic function of a submitting SMTP mail server. The check is performed by receiving response from the server, or directly by sending a testing email.
The image shows an example of a typical setup.
In step 1, enter DNS name or IP address of the SMTP server and port, on which the server communicates.
In step 2, you may choose to adjust the value of "Retries", which is defaultly set to "4" and the value of "Timeout in sec", whose default value is "15".
You may also choose any type of authentication: Autoselect, Simple Login, Plain, CRAM-MD5, CRAM-SHA1, NTLM. The type of authentication depends on settings of the SMTP server.
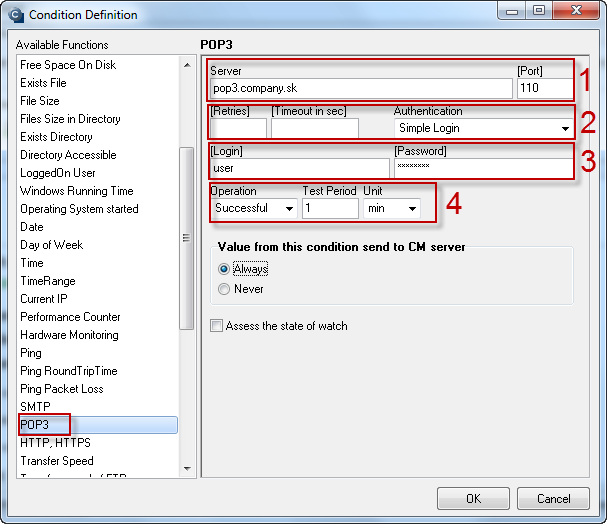
POP3
The condition POP3 serves to monitoring of a POP3 server's function, based on success of login and functional course of the POP3 communication's protocol.
The image shows a typical setup of the condition.
In step 1, enter DNS name or IP address of the POP3 server and port, on which the server communicates.
In step 2, you may choose to adjust the value of "Retries", which is defaultly set to "4" and the value of "Timeout in sec", whose default value is "15".
You may also choose any type of authentication: Simple Login, CRAM-MD5, CRAM-SHA1.
The type of authentication depends on settings of the POP3 server.
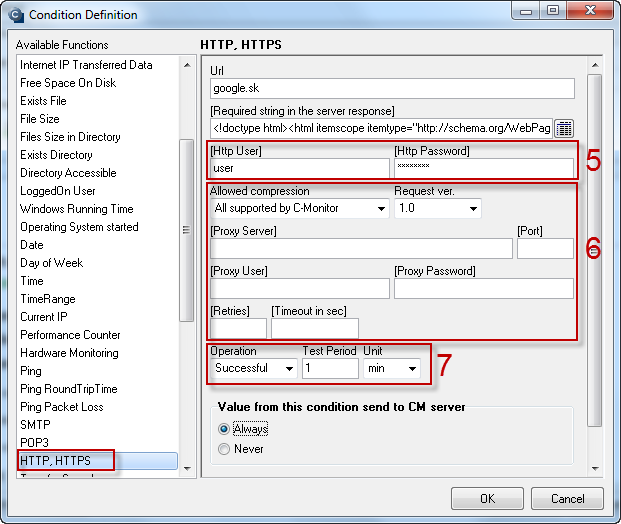
HTTP, HTTPS
By this condition, you can monitor function of a selected HTTP or HTTPS location, via http or https protocol.
The first image shows the first part of the condition's setup.
In step 1, enter address of the required location.
In step 2 and 3, list out and choose what string does the http or https location send at request from your side.
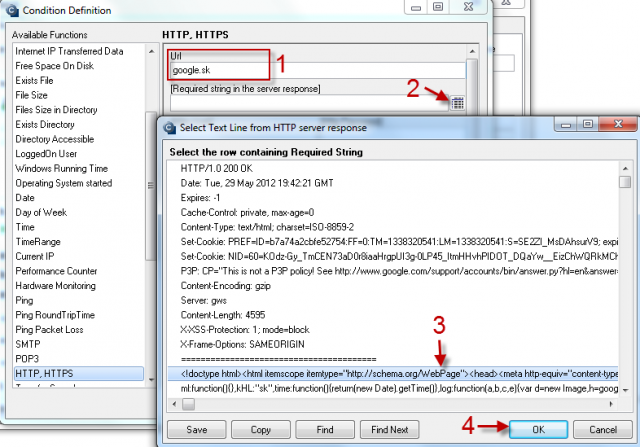
Image no. 2 shows the second part of the setup.
Step 5 - If a HTTP or HTTPS login is required, e.g. for an intranet web, web-mail page etc. , enter it here.
Step 6 - If you want to change some of the default settings of the communication according to your specific requirements, feel free to do so.
In step 7, choose the expected result of the operation, time value and unit of the testing period.
HTTP, HTTPS response time
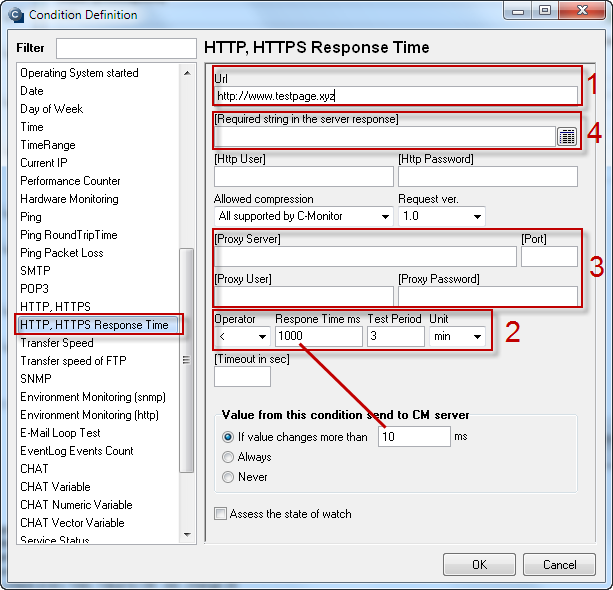
the condition serves to monitoring of connection quality by measuring loading time of a http or https page (without images). The advantage of this condition, is that you can measure connection quality through Proxy server as well. However, you must choose a page, which is reloaded at every access. These are for example:
1. Static html pages with meta tags to disable caching:
               <meta http-equiv='Cache-Control' content='No-Cache' />
               <meta http-equiv='Pragma' content='No-Cache' />
               <meta http-equiv='Expires' content='0' />
2. dynamic pages, whose url contains ? or /cgi-bin/ , i.e. any page with get parameters (after the question mark)
Optionally, you can put the following code to your very reliable web server :
<!DOCTYPE HTML PUBLIC "-//W3C//DTD HTML 4.01 Transitional//EN">
<html>
<head>
<title>Test of webserver response</title>
<meta http-equiv='Content-Type' content='text/html; charset=UTF-8' />
<meta http-equiv='Content-Language' content='sk'>
<meta http-equiv='Cache-Control' content='No-Cache' />
<meta http-equiv='Pragma' content='No-Cache' />
<meta http-equiv='Expires' content='0' />
<meta name='Language' content='sk' />
<meta name='Robots' content='none' />
</head>
<body>
A page to measure webserver response.
</body>
</html>
In step 1, enter the address of location that should be measured.
In step 2, choose the expected result of the operation, value and period of testing. To avoid unnecessary load of the CM server, enter how should the measured value change to be sent to the CM server.
Optionally in step 3, enter parameters of Proxy server, through which should the page be loaded.
Optionally in step 4, choose a string that the page should contain (i.e. you'll be sure, that the loading was complete.) If the string is not found on the page, the condition is switched to Unknown state
Transfer Speed
Táto podmienka slúži na sledovanie prenosovej rýchlosti medzi priečinkami, či už lokálnymi, alebo lokálnym a sieťovým.
Možete merať rýchlosť Upload (zdroj do priečinku) aj Download (priečinok do RAM).
Obrázok ukazuje nastavenie pre testovanie rýchlosti kopírovania medzi dvomi lokálnymi zložkami.
Folder do ktorého chcete uploadovať, prípadne aj používateľské meno a heslo, ak ide o sieťový priečinok, nastavíte v kroku 1.
Source folder, v ktorom sa nachádzajú súbory určené pre testovanie nastavíte v kroku 2.
V kroku 3 môžete vybrať masku súborov, ktoré budú použité pre testovanie.
V kroku 4 vyberte či chcete testovať rýchlosť upload, alebo download, požadovaný operátor, hodnotu a jednotku prenosovej rýchlosti.
Krok 5 určuje periódu testovania. Je treba brať na zreteľ že tento test zaťaží diskový systém a prípadne aj sieť, ak ide o testovanie medzi lokálnym a sieťovým priečinkom.
Krokom 6 nastavíte veľkosť zmenu hodnoty, pri ktorej sa hodnota odošle na CM server.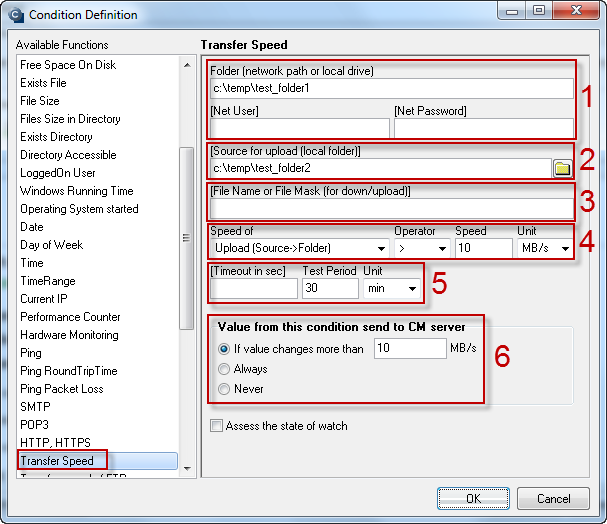
Transfer speed of FTP
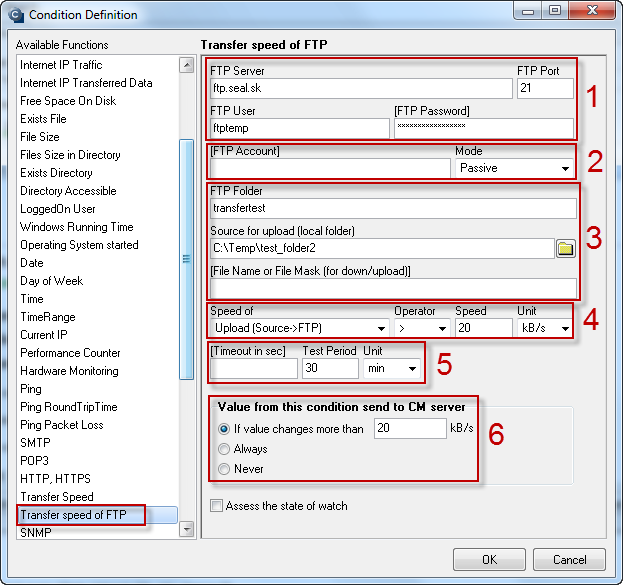
The condition is designed to track transfer speed between a local directory and a directory on FTP server. You can choose to monitor either upload, or download.
Execution of this condition may cause a huge load of network resources, therefore it's necessary to use appropriate file size for the testing, and set a convenient testing period.
On the image is an example for testing of transfer speed on FTP server ftp.seal.sk by the directory transfertest and the local directory C:\Temp\test_folder2, where the file intended for the transfer is stored (steps 1 to 3).
Whether it's testing of upload/download, operator and the compared transfer speed, is all set in step 4.
Step 5 defines the mentioned testing period.
In step 6, define the change for which the value is sent to the CM server.
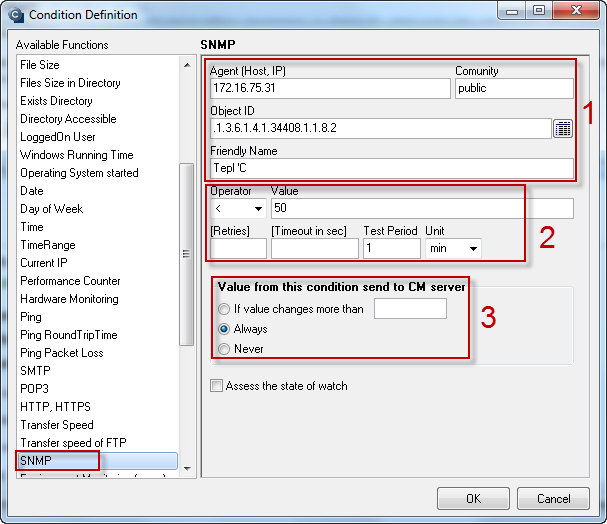
SNMP
The condition serves to check the values from devices with SNMP support. SNMP is an abundantly developed area, and you might consider it one of the pillars of monitoring. Currently, you can choose any SNMP parameter, for which you'll test the returned value. This can apply either for a number or a string. We do not recommend direct linking with MIB files yet, the data obtained from devices must be first analyzed by another MIB browser, for instance http://www.ireasoning.com/mibbrowser.shtml.
Enviroment Monitoring (snmp)
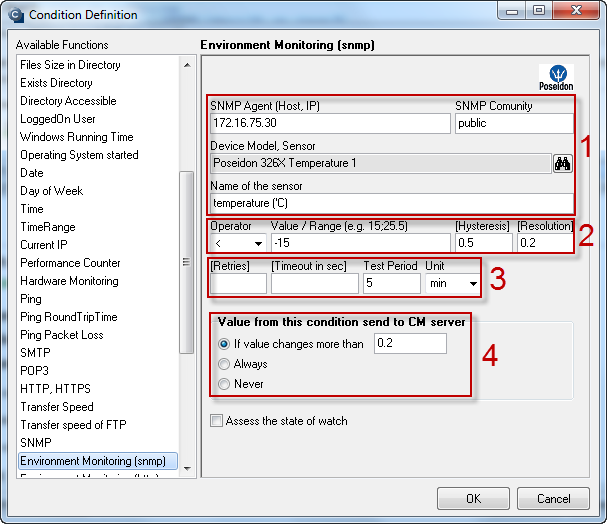
The condition Enviroment Monitoring (snmp) serves to monitoring of the environment by reading data from the snmp protocol.
The image shows setup of the condition to monitor snmp information from the device Poseidon.
Communication between CM condition and the device is set in step 1 according to concrete settings of your device's snmp transmission.
Setup of the value, which you want to compare the sample with, hysteresis (limit, in which if the value moves even after exceeding the set value, the watch's state won't change) and resolution (resolution of rounding of the value - you can also round to more decimal places, e.g. by entering 0.01), is done in step 2.
Step 3 defines the testing period.
Step 4 defines size of change, which leads to notification to CM server.
Enviroment Monitoring (http)
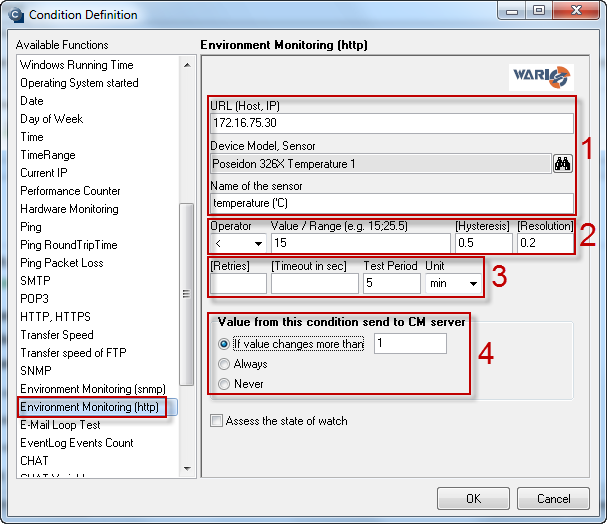
Similarly to Enviroment Monitoring (snmp), this condition serves to monitoring of environment. The difference between these two conditions is just the protocol they're using for communication.
Setup of the condition is almost identical as well.
E-Mail Loop Test
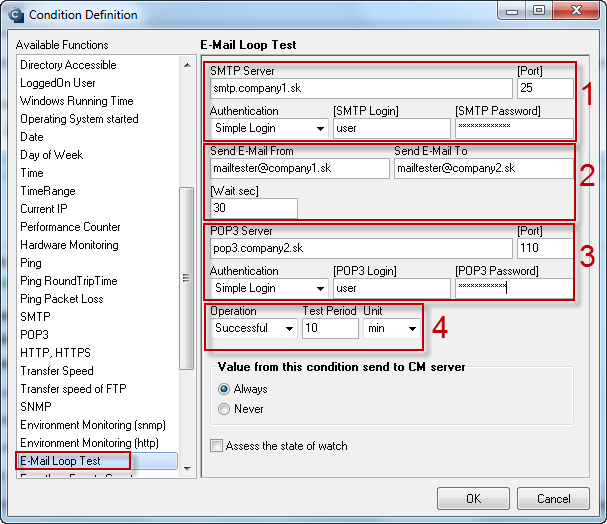
E-Mail Loop Test is an extended and combined version of the conditions POP3 and SMTP.
This condition verifies sumbission of a message through SMTP server, and subsequently checks reception of the message on another server through POP3 protocol.
The image shows an example of testing of sending from the server smtp.company1.sk (step 1), using defined addresses of the sender, receiver and delay in seconds, after which the message's reception will begin (step 2) to be verified on pop3.company2.sk (step 3).
Set a required testing period in step 4.
EventLog Events Count
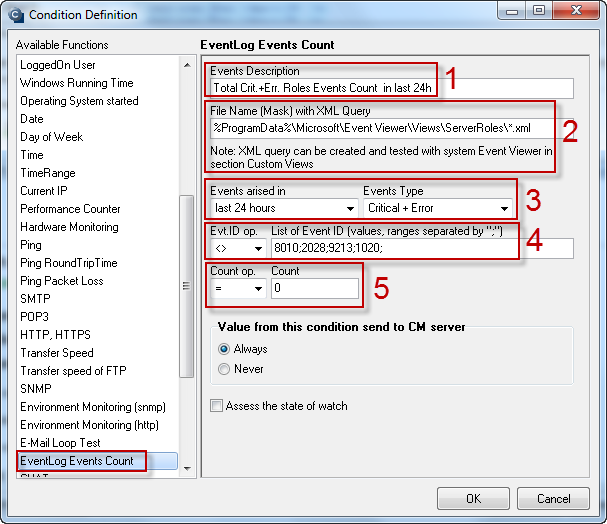
If you want to have occurrence of errors in EventLog under control, use this condition.
The condition reads information out of .xml, where the system writes its logs.
The image shows an example of the condition's setup, which will warn you about presence of an error, or a critical error in the EventLog's .xml file (defined in step 2) for the past 24 hours (step 3), except Event ID, which are excluded in step 4.
Step 5 determines tolerance of errors, which are still accepted as OK state, but in our case there's zero tolerance.
Chat
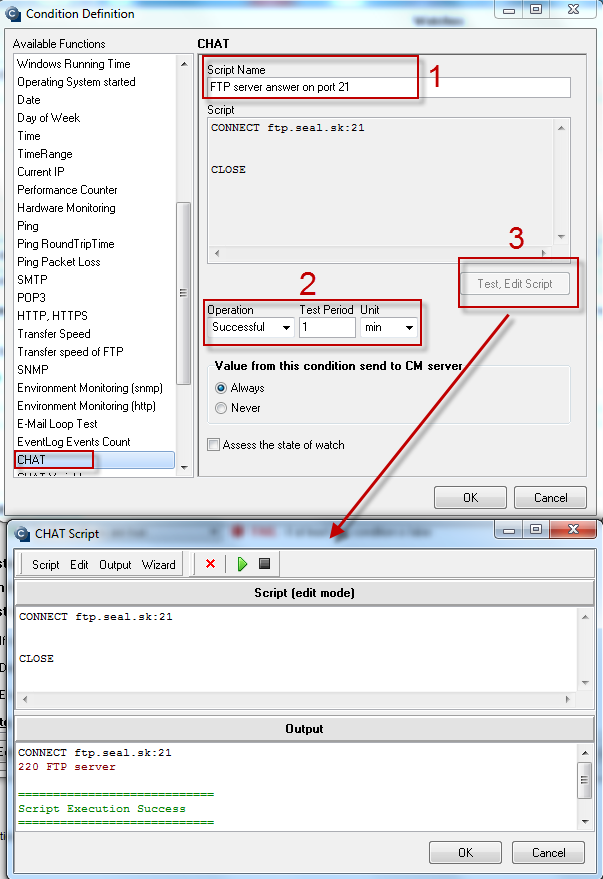
The condition serves to verification of function of a service based on conversation with a service (TELNET,FTP, SSH, ...). Evaluation of the service runs sequentially in steps. If the service doesn't answer to one of the steps in a defined time, the script will be interrupted and the condition evaluated as failed. The location of the interruption will show in displays (points 6,7). If the conversation was successful (The service has answered to all requests), the condition will result as OK. The language and dictionary of the conversation depends on the service, by which you comminicate.
The image shows setup of the condition to monitor a simple script, to get response from the ftp server on port 21.
In step 1, choose a convenient name for the script.
In step 2, set the expected result and testing period.
Step 3 is the most important one, which allows creation, editation and test of the script.
The editor also contains predefined scripts that can be adjusted according to your needs - the wizard option.
More about this function can be found at Advanced monitoring through CHAT scripts.
Chat Variable
Functionality for advanced users, read more about this functionality at Advanced monitoring through CHAT scripts.
Chat Numeric Variable
Functionality for advanced users, read more about this functionality at Advanced monitoring through CHAT scripts.
Chat Vector Variable
Functionality for advanced users, read more about this functionality at Advanced monitoring through CHAT scripts.
Service status
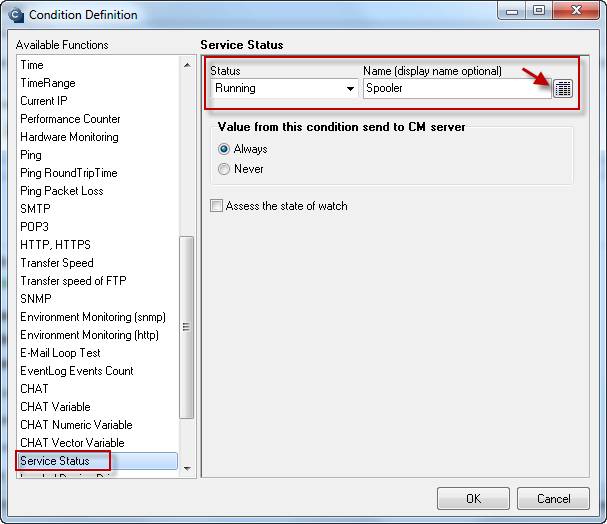
The condition serves to evaluate state of a service. One of the basic functions of programs' status.
You can choose to monitor, whether the selected service is :
Running, Not Running, Installed, Not Installed, Stopped, Not Stopped, Start Pending, Not Start Pending
Loaded Device Driver
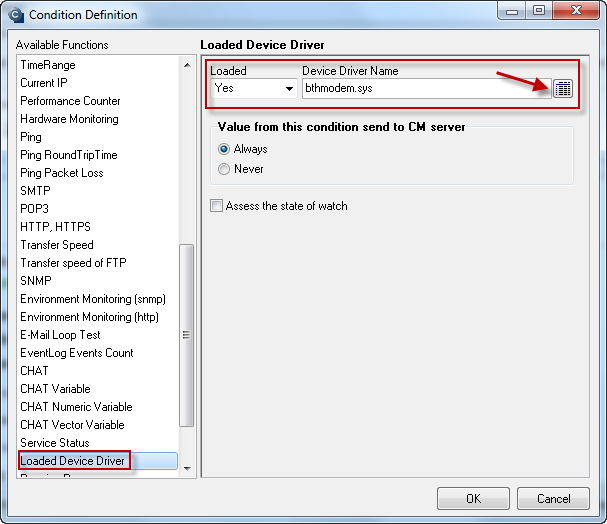
By this condition, you can monitor loading of a drive selected from the list.
Running Process
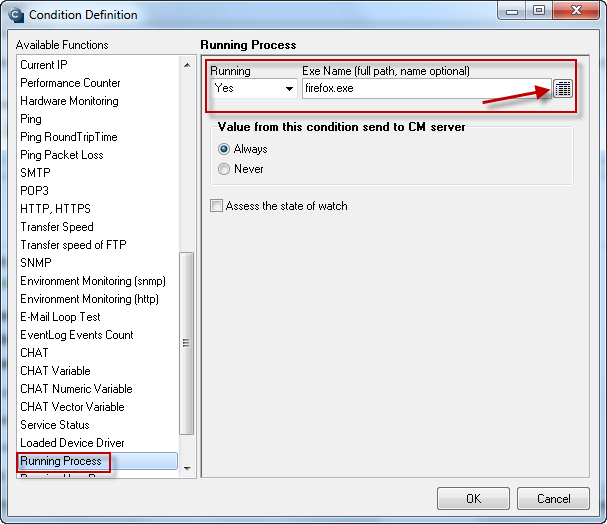
The condition is intended for evaluation of running processes on the computer.
In the field "Running", you can choose the following functions:
Yes, Yes = 1x, Yes > 1x, No, In Front
Running User Process
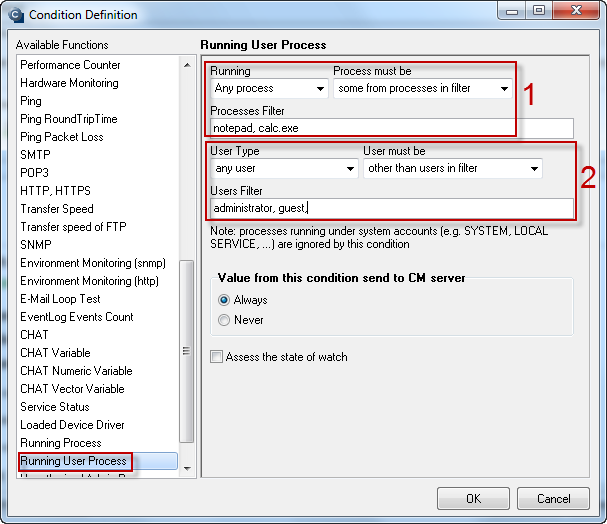
This condition is intended for evaluation of running processes on the computer, which can also be identified on the level of concrete users .
The image with setup of this condition shows an example for monitoring of running processes "notepad" and "calc.exe" (step 1) by any user, except users administrator and guest (step 2).
Unauthorized Admin Process
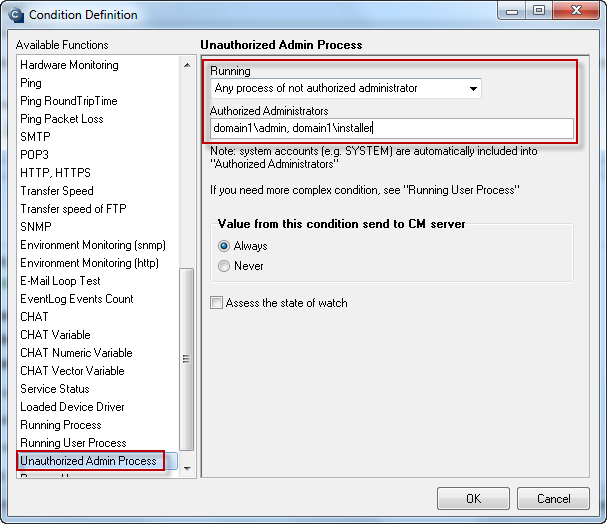
This condition is convenient for enhancing security of the system.
It notifies you if an unauthorized admin launches a process with admin authorizations.
For example, an experienced user resets the password of the local admin, or any other local account with admin permissions and begins to install some software. The condition automatically compares the admin account, under which the process is running, with authorized accounts defined in the condition, and if it's not found in the list, the condition is switched to failed state. Therefore, you're notified about the event.
It is important to use domain accounts designed for maintenance as the authorized accounts.
Process Usage
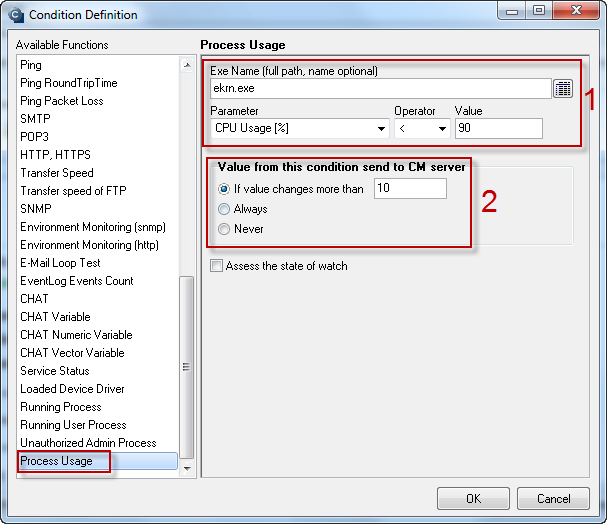
By this condition you can monitor load of CPU or the memory by any process, which you select from the list, or write down manually (image step 1).
In the item parameter, choose the medium, whose load you want to track.
You can choose between CPU Usage [%], Memory usage [% phys], Memory usage [KB], Memory usage [MB]..
In step 2, set size of the change, whose value from the condition will be sent to CM server.