Signalization of overload via Watches
Notifications of overloads of servers, computers and the course of their load with up to two-month history can be acquired from Watches. In this article, we'll advise you how to configure monitoring with notification from usage of CPU, RAM and load of disks.
Recommendation : If you haven't worked with C-Monitor console yet, then read the Introduction to setup of Watches, conditions, actions
Skip to Example of setup of overload monitoring through CM portal (for all OS types)
Skip to View of the current state and history of overloads on CM portal
Example of setup of overload monitoring through C-Monitor Console on Windows
Create a watch to check Server overload. Select Memory usage as the first condition.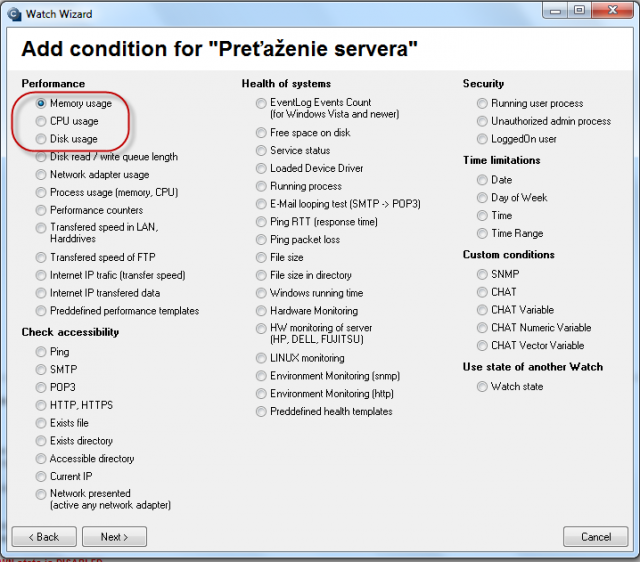
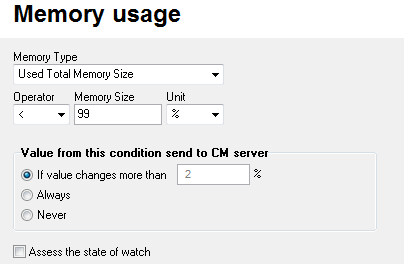
in Memory type, choose Total memory usage, set the operator to < and the value to 99%. The high value is selected, as we expect that in a normal state, the usage of RAM shouldn't be high. Set the value of change (If value changes more than) to e.g. 2-5%. Each value that reaches a change by the selected number of percent is sent to the CM server. As the server should not be unnecessarily loaded, it's appropriate to choose a higher number, but in a way, that the view on CM portal shows relevant changes of the monitored parameter.
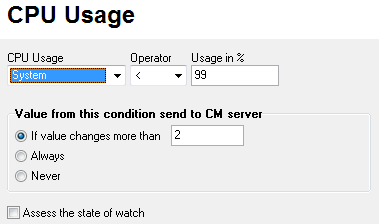
Click on Next and then on Add condition, where you select CPU usage. In the next window set the operator to < and the value to 99%. The high value is selected, as we expect that in a normal state, the usage of CPU shouldn't be high. Set the value of change (If value changes more than) to e.g. 2%. Each value that reaches a change by the selected number of percent is sent to the CM server. As the server should not be unnecessarily loaded, it's appropriate to choose a higher number, but in a way, that the view on CM portal shows relevant changes of the monitored parameter.
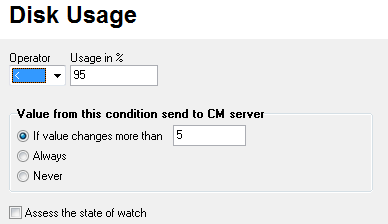
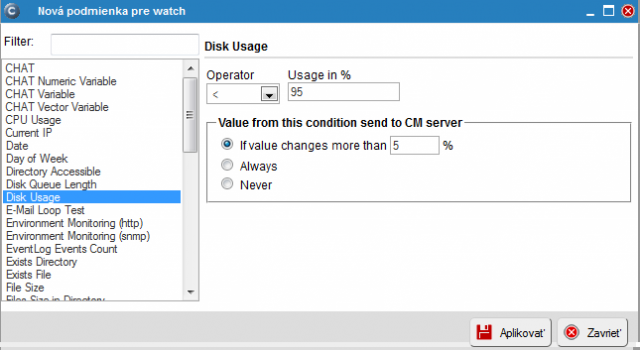
Press Next and add the condition Disk Usage. In the next window set the operator to < and the value to 95%. The high value is selected, as we expect that in a normal state, the disk usage shouldn't be high. Set the value of change to e.g. 5%. Each value that reaches a change by the selected number of percent is sent to the CM server. As the server should not be unnecessarily loaded, it's appropriate to choose a higher number, but in a way, that the view on CM portal shows relevant changes of the monitored parameter.
After the conditions are entered, it's advisable to tick Delay for False. The Delay for sending notifications is set, so that not every bigger load of the server is notified as a False state. It's likely, that the server sometimes uses maximum of the hardware resources, e.g. when working with a huge amount of files, at execution of certain programs etc. However, this state should not last too long. Set the length of the delay for sending notifications in respect to the running processes, as well as usage of the server itself.

After pressing Finish, the watch's configuration is complete. If you select the watch as Enabled, you'll be able to view its status directly in the PC's C-Monitor console, in the top left menu watches state.
Example of setup of overload monitoring through CM portal (for all OS types)
A watch can be created even without direct access to the PC, by adding it though CM portal. After login to CM portal, open Admin zone and in the left menu Watches - Settings. Enter parameters of the required computer into the upper filter. After finding it, you'll see the PC/server along with its already existing watches, if there are any. After clicking on Display watches, you'll get to the option to add a new one.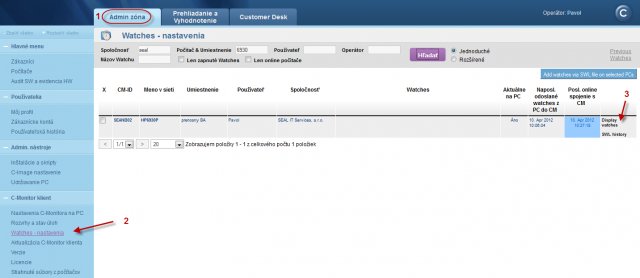
Click on Add watch to start creating a new watch
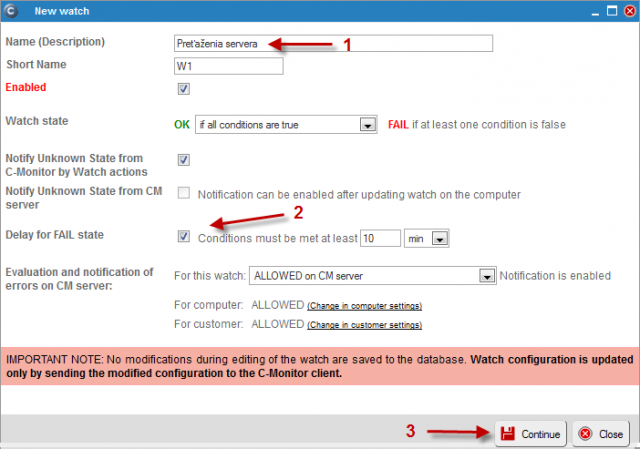
Name the watch e.g. Server Overload in the popped-up window. It's advisable to tick Delay for False. The Delay for sending notifications is set, so that not every bigger load of the server is notified as a False state. It's likely, that the server sometimes uses maximum of the hardware resources, e.g. when working with a huge amount of files, at execution of certain programs etc. However, this state should not last too long. Set the length of the delay for sending notifications in respect to the running processes, as well as usage of the server itself. Then press Continue.
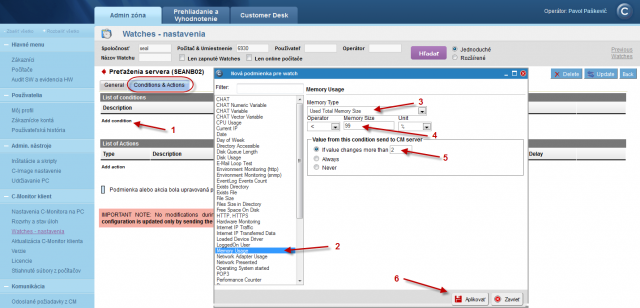
The tab Condition & Actions will open, and by pressing Add condition, you'll add the first condition for monitoring of RAM usage, i.e. select Memory usage from the list. In Memory type, select Used Total memory size, set the operator to < and the value of Memory size to 99%. The high value is selected, as we expect that in a normal state, the usage of RAM shouldn't be high. Set the value of change (If value changes more than) to e.g. 2%. Each value that reaches a change by the selected number of percent is sent to the CM server. As the server should not be unnecessarily loaded, it's appropriate to choose a higher number, but in a way, that the view on CM portal shows relevant changes of the monitored parameter. Then press Apply.
By another clicking on add condition, we'll similarily add a condition for usage of CPU. Select CPU usage from the list. In the next window, set the operator to < and the value to 95%. The high value is selected, as we expect that in a normal state, the usage of CPU shouldn't be high. Set the value of change (If value changes more than) to e.g. 5%. Each value that reaches a change by the selected number of percent is sent to the CM server. As the server should not be unnecessarily loaded, it's appropriate to choose a higher number, but in a way, that the view on CM portal shows relevant changes of the monitored parameter. Press Apply when the parameters are entered.

Finally add a condition for load of disks. Add the condition Disk Usage. In the next window, set the operator to < and the value to 95%. The high value is selected, as we expect that in a normal state, the usage of RAM shouldn't be high. Set the value of change to e.g. 5%. Each value that reaches a change by the selected number of percent is sent to the CM server. As the server should not be unnecessarily loaded, it's appropriate to choose a higher number, but in a way, that the view on CM portal shows relevant changes of the monitored parameter. Press Apply when the parameters are entered.
When the conditions are entered, click on Update. After this step, you'll see two warning windows. In the first one, confirm sending of the watch to the PC/server.
The second window contains a warning, that you shouldn't edit the watch until it's received on the PC/server
View of the current state and history of overloads on CM portal
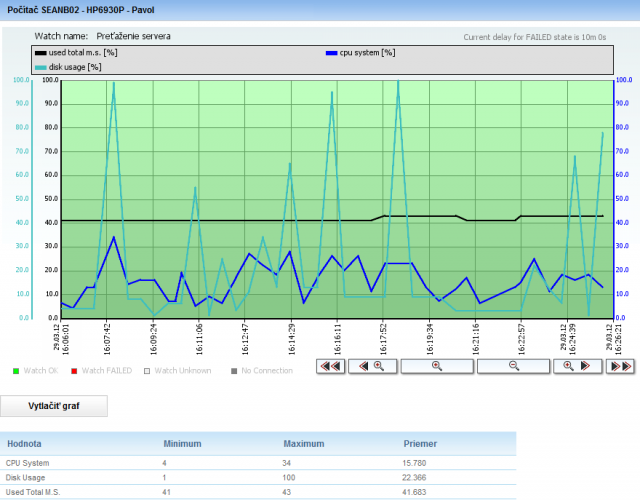
The online status, as well as history can be viewed on CM portal at Presentation and Evaluation -> Watches (online monitoring), search either the computer or the specific Watch through the upper filter

After clicking on the watch's name, you'll see its history