Summary overviews for computers (up to WIN7/2008) in LAN network
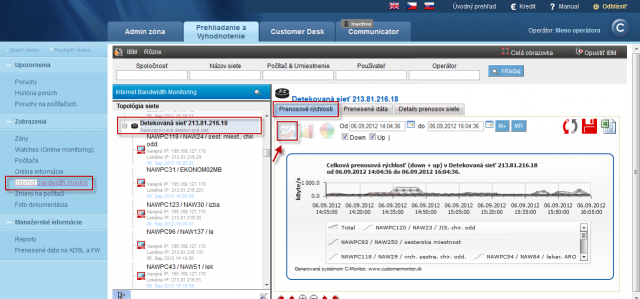
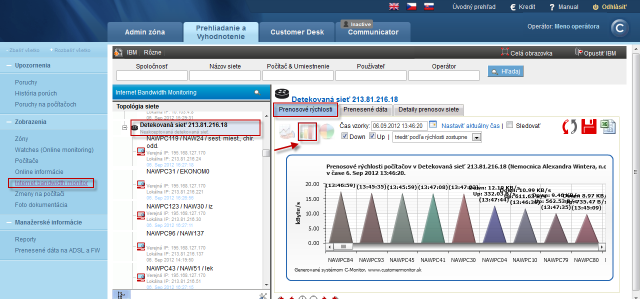
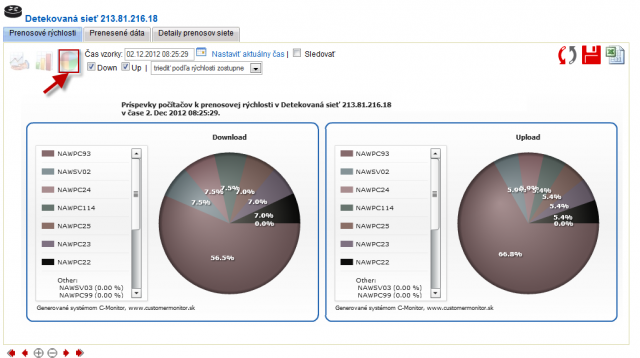
IMB also offers a detailed overview of transfer speeds, as well as all transferred data for the selected network. Start by clicking on the detected network (it doesn't have to be accepted) in network topology. In the top right part of the screen, the courses of transfer sppeds for the past two hours will appear automatically, standardly download and upload for all computers contained in the network. Each computer has his own assigned color in the graph. When necessary, you can change the time interval for display of speeds - either in the top right section of the screen, by directly selecting the required date, or by clicking on the arrows at the bottom part. By clicking on any point in the graph, or by selecting the option Bar graph, you'll see a transparent bar graph, which describes the transfer speeds of individual computers, for a monitored time period. For percentage view of transfer speeds of individual computers, select Pie graph. The displayed courses can be exported by clicking on the icons at top right section, into .png or into the well known excel .xls format
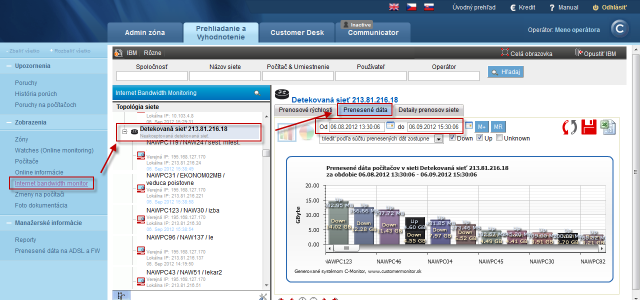
Overview of transferred data for the whole network can be obtained similarly as the display of transfer speeds, by clicking on the detected network in network topology, and in the left part of the screen, select the tab Transferred data. This will defaulty display a bar graph with computers of the selected network, where there's also given the volume of transferred data for the past two hours. Change of time interval, disable or enable of showing Download, Upload, Unknown, as well as criteria to display the graph, is all adjusted in the top part of the window. The displayed graphs can be exported into .png or .xls format by clicking on the corresponding icons. Unknown is an unrecognizable transfer, which occurs when request for the transfer comes from outside. Example: There was access to disk from another network possible, and data have been copied. Transfers of masked processes are included as well. It's not possible to send all information about the transfer in real time. We can only detect the whole transfer. The difference between total transfer and real-time transfer is called correction. The correction is minimized after obtaining reports, which are received with a few hour delay.
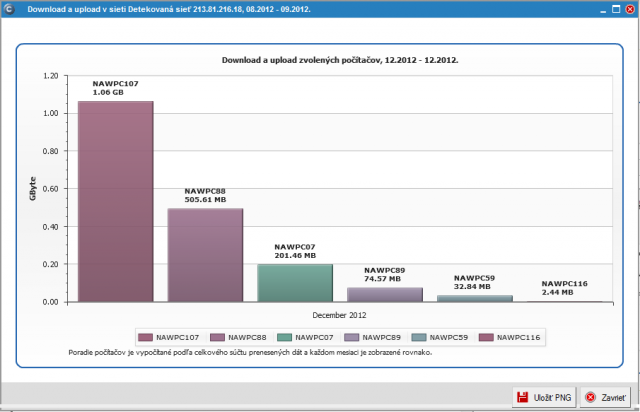
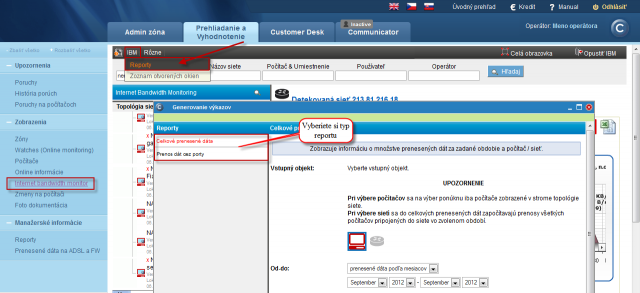
In section reports, you can view information about the amount of transferred data for the whole network or a concrete computer in a required interval. First select "Input object", where we choose between monitoring of the whole network or a selected computer, in "Time intervals" you may display the data in the "from-to" form for specific dates or entire months. The output is display into a graph with an option to save it into .png format, or directly into
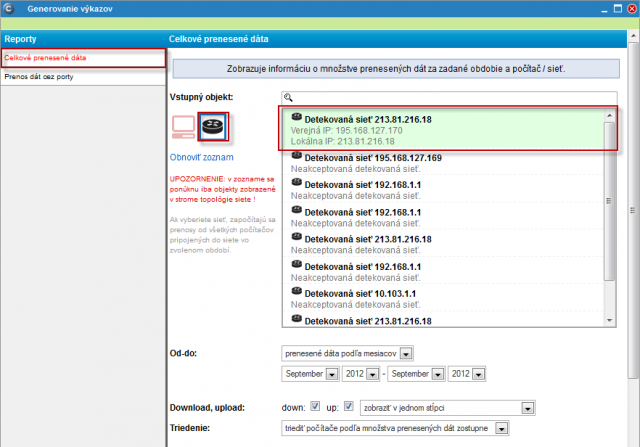
In the next window, after selecting time period, choose the required output type in the bottom part (grapgh, xls...)
Graphic output for the whole network is illustrated on the following image.
