Histogram of computer load
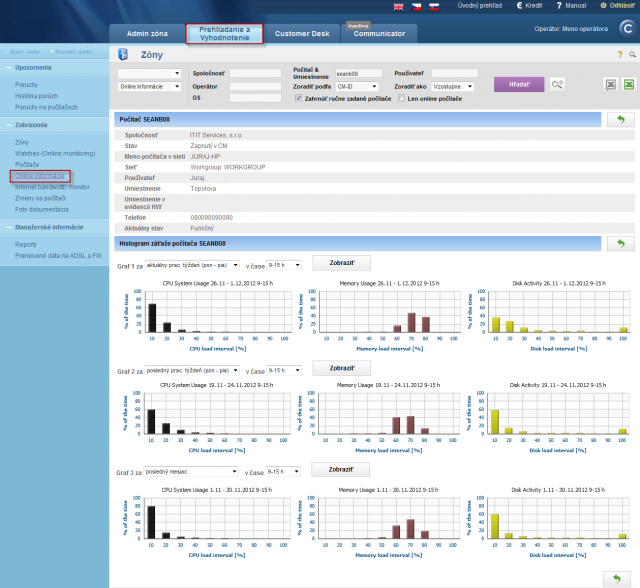
The Histogram of computer load shows three basic parameters of computer load in transparent graphs. Here you'll find an overview of load of Processor (CPU), Memory (RAM) and Disk Activity.
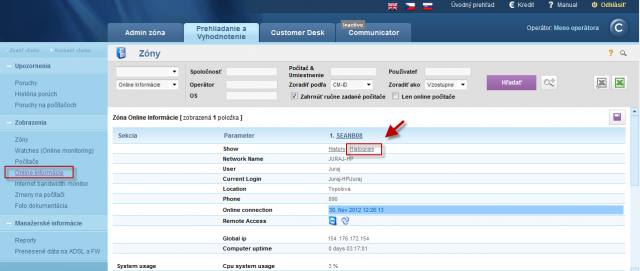
Histogram of computer load can be displayed in the section Presentation and Evaluation -> Presentation -> Online information, by clicking on the button Histogram, as displayed on the next image.

You'll then choose the time period, for which you want the histogram to be shown.

Based on the information from the histogram, you can tell how much and at what times is a computer loaded the most, eventually if the computer is even suitable for work, or if the user is limited by its performance. Example: if the graph from load of a computer's RAM memory is constantly near 100%, you can tell that the computer has insufficient RAM memory and that's why certain applications, or the entire system, work slowly or freeze.
Output of computer status can be also displayed for the entire company (customer) by a transparent report. More about this report can be found in the section Report of computer status.

