How CM works

Customer Support

+421-2-5465-0242

send email >>

Online support - chat (bottom right)

MS SQL performance by measuring of time

The optimal way how to get the total MS SQL server's performance is to measure time of an operation, which is similar to the one executed by the application running over MS SQL. In other words, query the SQL server for certain information, or make unified operations directly in the application's database (we assure you, that these are absolutely safe toward data in the database and application)

There are two "performance" templates for measuring of time over MS SQL available :

1. MS SQL Query Response time  - measures time of operation sequence :
            connection to the database,
            requesting system time from the SQL server  
            disconnection from the SQL server
   Setup procedure (below in the article)

2. MS SQL Query Response time with table - measures time of operation sequence :
          connection to the database,
          creation of a table with 300 rows and 5 columns, which it'll fill with the current date
          deletes this table

          disconnection from the database
   Setup procedure (below in the article)


1. Setup procedure to MS SQL Query Response time

Watch measures time of this operation sequencemeria čas sledu operácií :
            connection to the database,
            requesting system time from the SQL server  
            disconnection from the SQL server

The result (value) is the time of operations in miliseconds, which is transferred for view and history archivation to CM Portal. A great value is around 50ms, but it may vary according to HW and version of the SQL server. Even a response higher by just +20% indicates a significant load, since the test consists of relatively quickly executable operations. You should empirically determine the value, at which your applications run fast, and when the system is getting slow, and set the Watch's limit value accordingly.
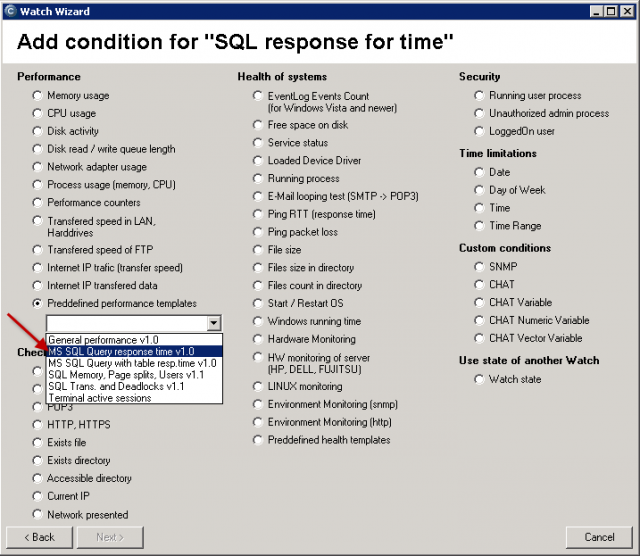
Selection of template in the Watches wizard in C-MonitorConsole for measuring of response with the timestamp command

Image: Výber šablóny v sprievodcovi Watches v C-MonitorConsole pre meranie odozvy s príkazom timestamp

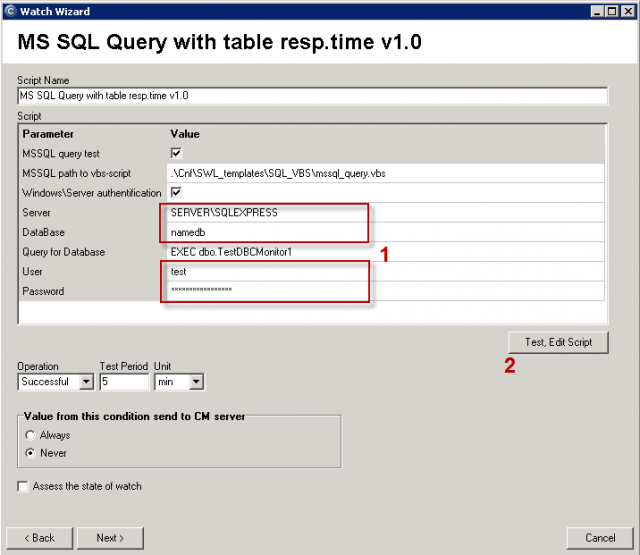
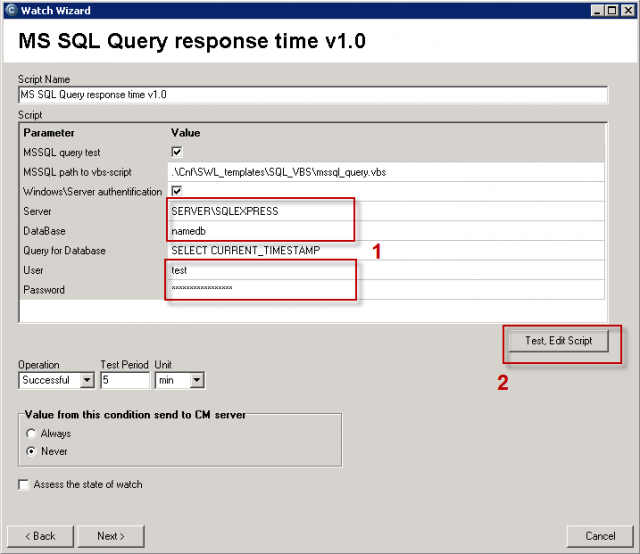
Fields to enter name of the SQL server, name of database, access data.  Continue by testing the script and the entered data

Image: Políčka pre zadanie názvu SQL servera, názvu databázy, prístupových údajov. Pokračujte pretestovaním skriptu a zadaných údajov

You must choose name of the SQL server, or instance, according to type of installation. For the first SQL instance with default configuration, type one of these alternatives into the field Server :
   1. server's network name
   2. server's network name\ name of instance (the instance name, if there's only one, is usually MSSQLSERVER or SQLSERVER or possibly SQLEXPRESS).
For other instances, write name of the service for the SQL server's instance in the form MSSQL$instance_name.
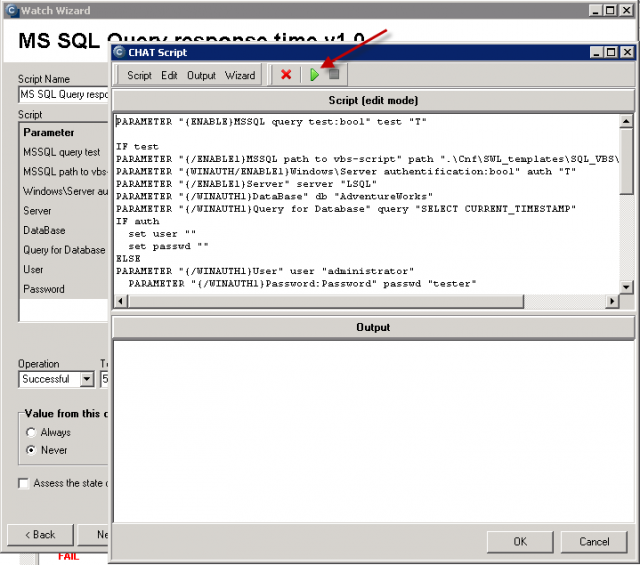
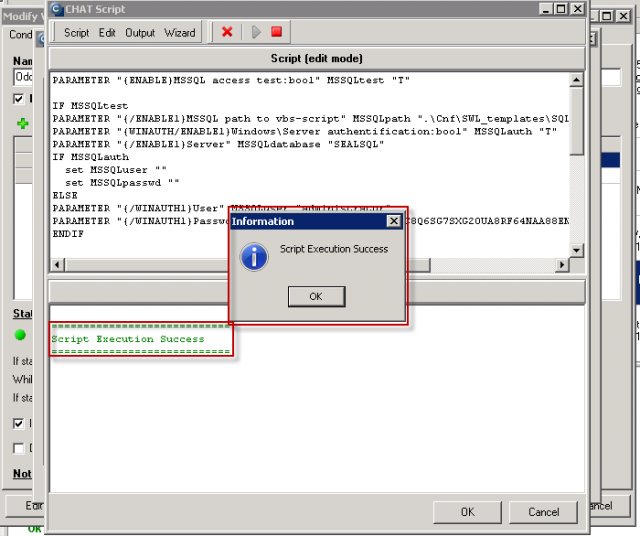
Launch of the script (by the green arrow)

Image: Spustenie skriptu (zelenou šípkou)


Communicated expected successful execution of the script. If an error occurs, react accordingly to the given error, it's usually well logged.

Image: Odkomunikované očakávané úspešné spustenie skriptu. Ak sa vám vyskytne chyba, reagujte podľa vypísanej chyby, obvykle je dobre zalogovaná.


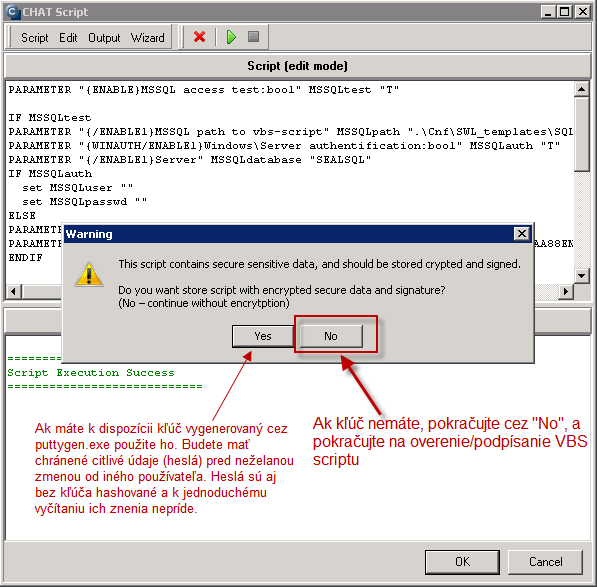
Since there are passwords saved in the script, C-Monitor offers their encryption by a key (you can for example obtain it through Puttygen, the same way you generate a key for SSH communication).

Image: Keďže v skripte sú uložené heslá, C-Monitor ponúka ich zakryptovanie pomocou kľúča (môžete ho získať napríklad cez Puttygen rovnakým spôsobom ako keď generujete kľúč pre SSH komunikáciu). Ak ho nemáte, použije sa hashovanie v rámci C-Monitora, čo ako zákl


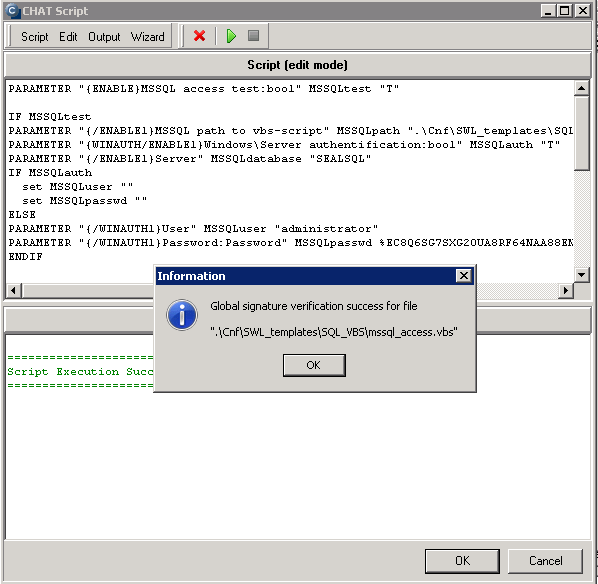
In the next step, it's verified whether your VBS script is signed, so that no one can replace it. If the signature is missing, you'll be automatically prompted to add it (you must be logged as administrator).

Image: V ďalšom kroku sa overuje, či máte podpísaný VBS skript, aby ho niekto nenahradil. Ak podpis chýba, automaticky sa vyžiada jeho doplnenie (musíte byť prihlásený ako administrátor).


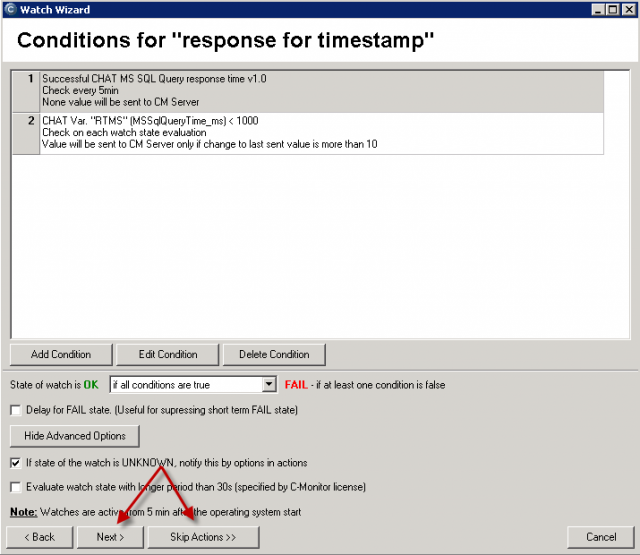
Further settings are identical for any other Watch, set actions or finish the setup without them.

Image: Ďalšie nastavenie je už identické ako akýkoľvek iný Watch, nastavte akcie alebo ukončite nastavovanie bez akcií.


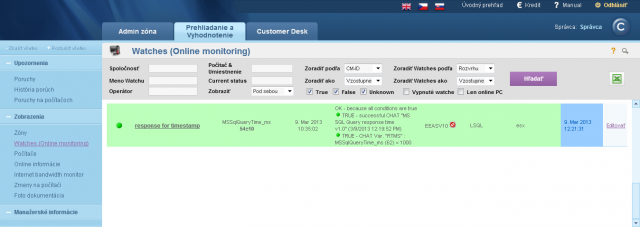
View of the measured value on CM portal

Image: Ukážka nameranej hodnoty na CM portáli


2. Setup procedute to MS SQL Query Response time with table (table operations)

measures time of this operation sequence :
          connection to the database,
          creation of a table with 300 rows and 5 columns, which it'll fill with the current date
          deletes this table
          disconnection from the database

The result (value) is the time of operations in miliseconds, which is transferred for view and history archivation to CM Portal. A great value is around 100ms. When the SQL server is loaded, the value can reach up to 500ms, which already signalizes reaction slowdown of the application that runs on the given server.

This section only describes the differences toward the above stated procedure. The main difference is that work with the table is realized by an SQL procedure, which has to be imported to the SQL server. The procedure is distributed in a C-Monitor installation file stored at 
drive:\CMonitor\Cnf\SWL_templates\SQL_VBS\sql_table_procedure_v1xx.sql.

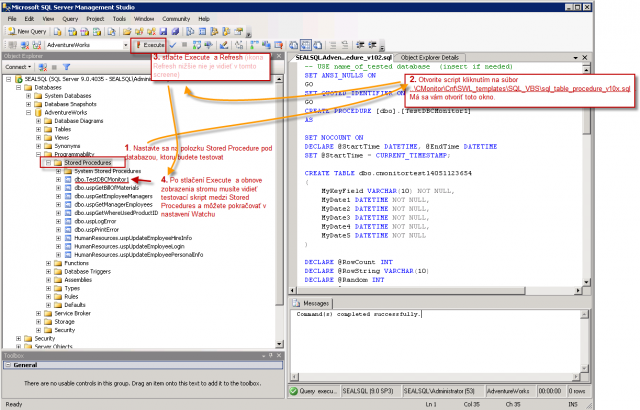
Import of the procedure to the SQL server

1. Open SQL management console
2. In hierarchy of SQL objects to SQL server, go to server / databases / your_database / Programmability / Stored Procedures
3. Doubleclick to open procedure 
drive:\CMonitor\Cnf\SWL_templates\SQL_VBS\sql_table_procedure_v1xx.sql.
4. Press Execute
5. Refresh the tree and check if this procedure was added under your database into Stored Procedures
dbo.TestDBCMonitor1
4. Close SQL management console

Tip  : It might occur, that the procedure will be saved under System databases /  Master. You should then open the procedure's file from C-Monitor - sql_table_procedure_v1xx.sql and use the command USE in the first line.

The original text is :
-- USE name_of_tested database  (insert only if needed and delete double dash at start of this row)

rewrite it to :
USE name_of_your_database


Opening the SQL management console

Image: Otvorenie SQL manažment konzoly


The process how to import the testing SQL procedure

Image: Postup ako importovať testovaciu SQL procedúru

Continuation of Watch settings is the same as in the first case

Only the template selection is different, other steps are identical
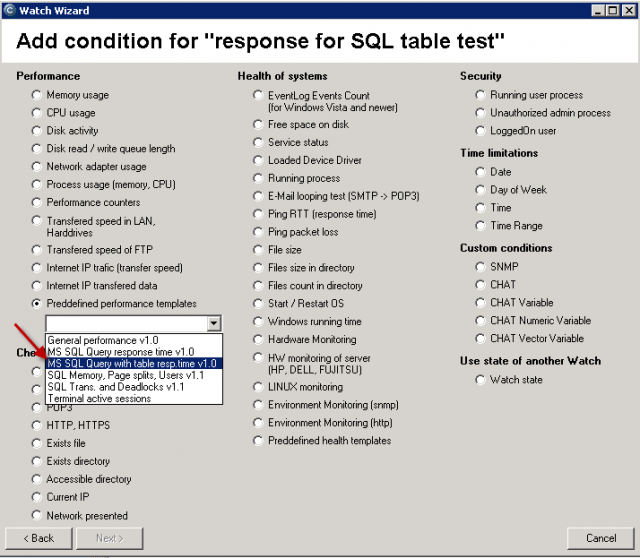
Selection of template in the Watches wizard in C-MonitorConsole for measuring of response with the table test

Image: Výber šablóny v sprievodcovi Watches v C-MonitorConsole pre meranie odozvy s tabuľkovým testom


Enter the SQL server (name selection is described in the above case), name of database, access data.

Image: Zadajte SQL server (voľba názvu je popísaná v prípade vyššie), názov databázy, prístupové údaje


Continue according to the above stated procedure.
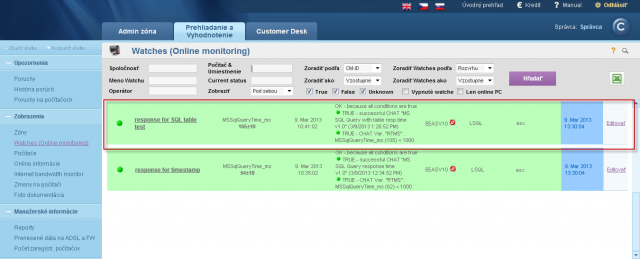
View of the measured data on CM portal
Image: Ukážka nameraných údajov na CM portáli

Images: 
Výber šablóny v sprievodcovi Watches v C-MonitorConsole pre meranie odozvy s príkazom timestampPolíčka pre zadanie názvu SQL servera, názvu databázy, prístupových údajov.  Pokračujte pretestovaním skriptu a zadaných údajovSpustenie skriptu (zelenou šípkou)Odkomunikované očakávané úspešné spustenie skriptu. Ak sa vám vyskytne chyba, reagujte podľa vypísanej chyby, obvykle je dobre zalogovaná.Keďže v skripte sú uložené heslá, C-Monitor ponúka ich zakryptovanie pomocou kľúča (môžete ho získať napríklad cez Puttygen rovnakým spôsobom ako keď generujete kľúč pre SSH komunikáciu). Ak ho nemáte, použije sa hashovanie v rámci C-Monitora, čo ako záklV ďalšom kroku sa overuje, či máte podpísaný VBS skript, aby ho niekto nenahradil. Ak podpis chýba, automaticky sa vyžiada jeho doplnenie (musíte byť prihlásený ako administrátor).Ďalšie nastavenie je už identické ako akýkoľvek iný Watch, nastavte akcie alebo ukončite nastavovanie bez akcií.Ukážka nameranej hodnoty na CM portáliOtvorenie SQL manažment konzolyPostup ako importovať testovaciu SQL procedúruVýber šablóny v sprievodcovi Watches v C-MonitorConsole pre meranie odozvy s tabuľkovým testomZadajte SQL server (voľba názvu je popísaná v prípade vyššie), názov databázy, prístupové údajeUkážka nameraných údajov na CM portáli