Determining the most burdening processes of CPU, RAM
The most burdening processes of CPU and RAM can be displayed in many places.
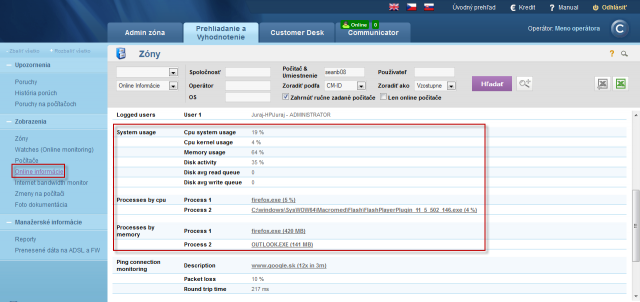
View of the most burdening processes of CPU, RAM in the section Online information
In the section Presentation and Evaluation -> Presentation -> Online information is displayed the current status and there are given two processes that load CPU and RAM the most among the highlighted lines with CPU and Memory processes, as shown on the next image. Based on this information, you can always tell, which processes are currently the most burdening for the device.
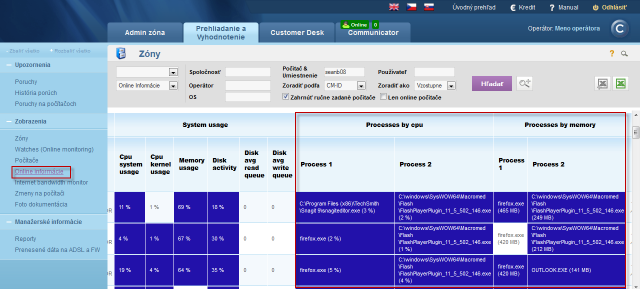
An example from table history of Online info and framing the columns with TOP processes.
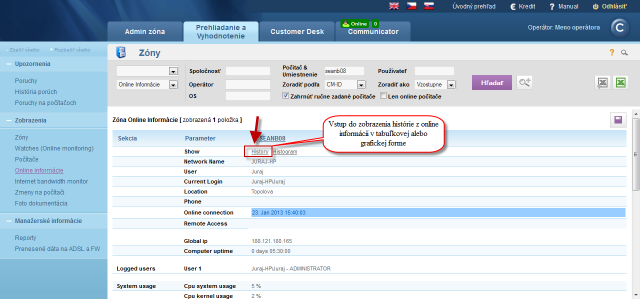
The history is shown max 24 hours ago.
View of the most burdening processes of CPU, RAM directly via C-Monitor client
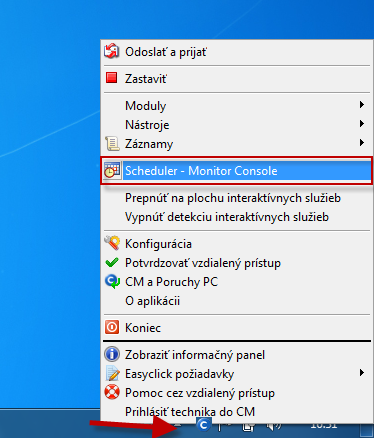
List of the most burdening processes can be displayed in the section Scheduler, to which you can enter through tray menu of the C-Monitor icon, as displayed on the following image.
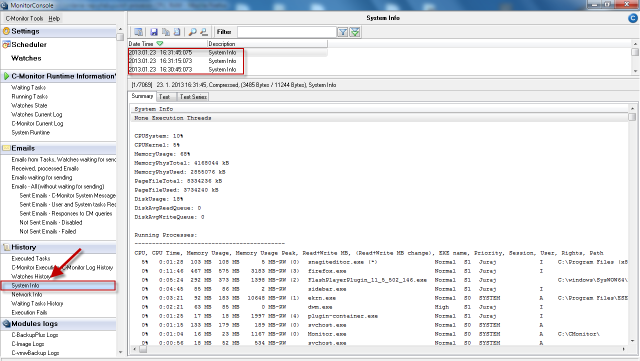
In the left menu click on the section System info, which will load a list of all processes that load CPU and RAM, with more detailed information about the specific processes. Description of the individual parts of this section, and more information can be found at System info.
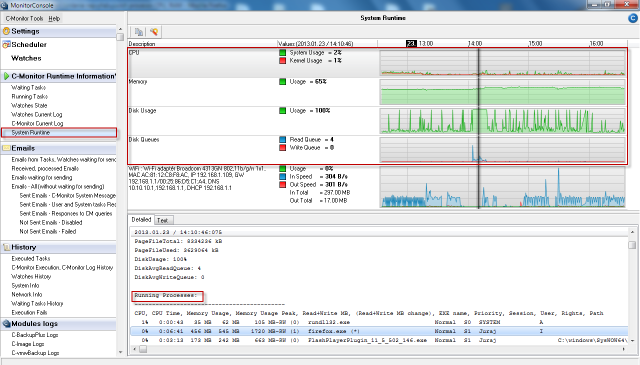
Evaluation and graph of course of the computer's load can be in C-Monitor scheduler also displayed in the section System Runtime as shown on the following image. The graph is interactive, which means that if you click anywhere on the graph, you'll see the values of system information that were measured at the time.
