Monitoring functions for terminal servers
These improvements will quickly help you to determine processes, which load out the terminal server's RAM and CPU the most, dividing them by specific users, so that you're able to immediately react and notify the user, or possibly to automate solutions of overloading - setting the processes, which most load out the terminal server, to be automatically turned off by Watches.
There are two places to view load of terminal servers :
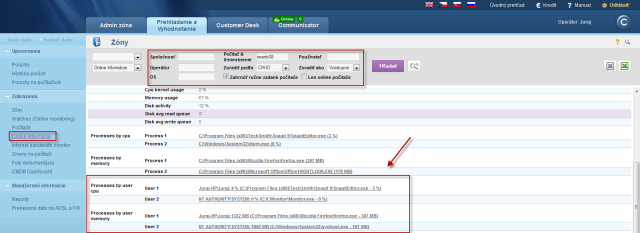
View in Online information load by TOP users
In the section Online information, you get instant information about two processes, which load CPU and RAM the most, also assigned to the user, who executed these processes
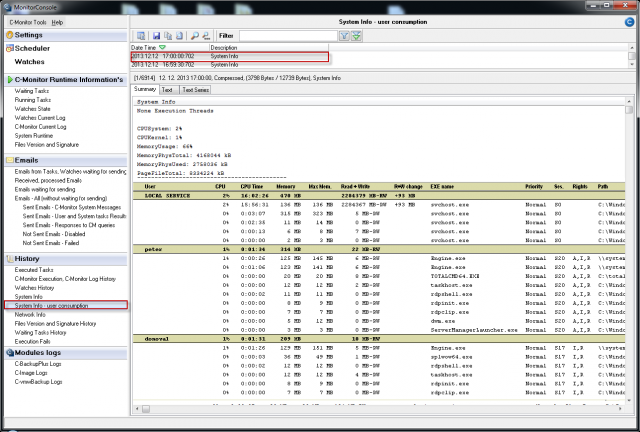
If you wish to view a detailed list of load of the terminal server, with division by users, it can be found through the C-Monitor client, section System info – user consumption, as you can see on the next image.
Monitoring and hard termination of a specific process, which is long-term loading the server with notification to the user in Watches
For automatic termination of processes, which load the server for a long time, you can configure a Watch, which will monitor the given process, and if it measures values higher than those you set as the limit values, this Watch will automatically terminate the process and notify the user, who had this process running.
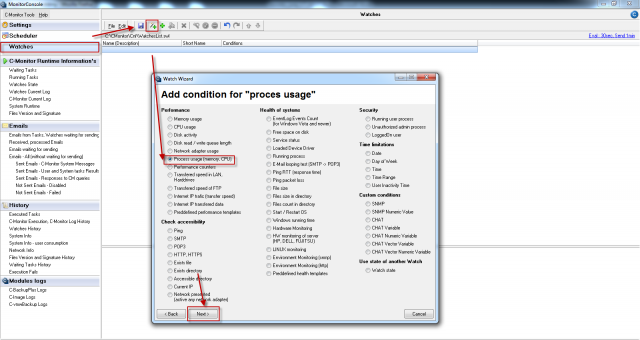
You can add this watch through C-Monitor client, in the section Watches by using the wizard, as displayed on the next image. Select the Watch called Process usage (memory, CPU) and press Next.
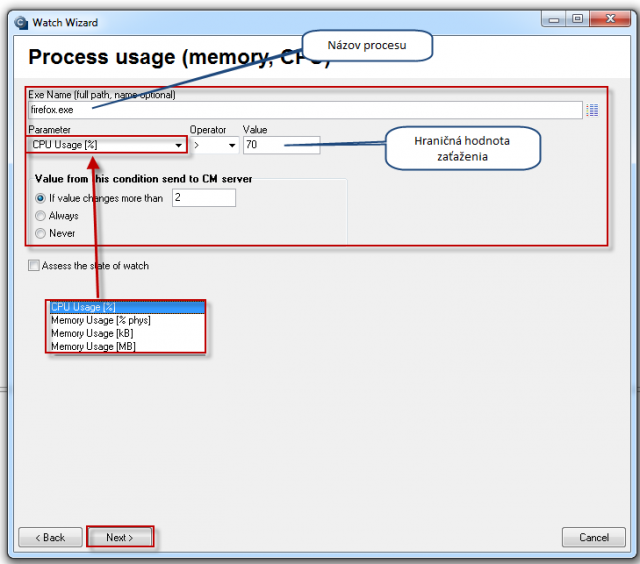
In the next window, choose a process, which the Watch is going to observe and set the limit value, by which this process can load the server.
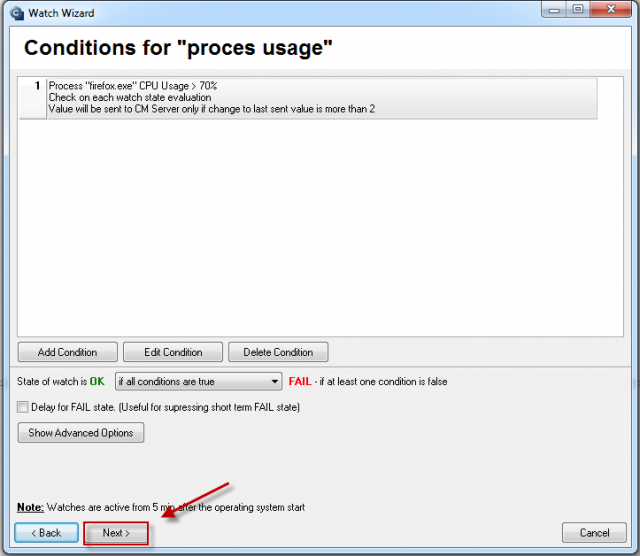
In the next window, you can add conditions to monitor more processes with only one Watch, when you're finished, press Next
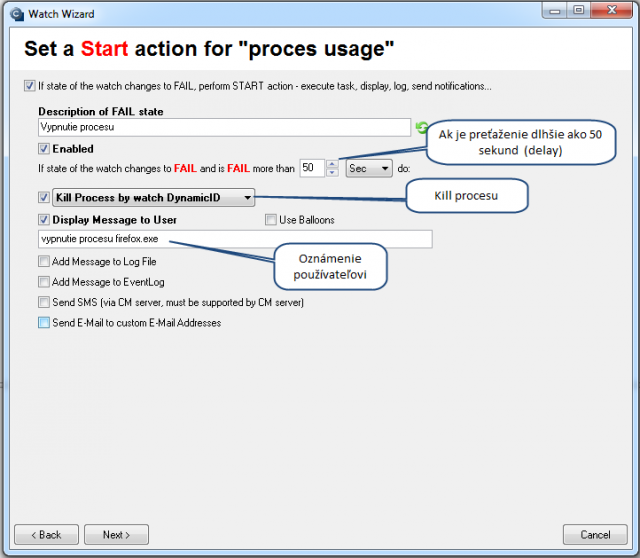
In the next window, you should configure an action that will be executed, in case the Watch is switched into Fail state, i.e. the process will begin to overload the server. To kill the process, select the option shown in the image - Kill Process by watch DynamicID. In the field above, you can set the time interval, after which will this action be executed (delay), in the third part you can type a message that will be displayed to the user when the process is terminated. All settings are illustrated on the next image
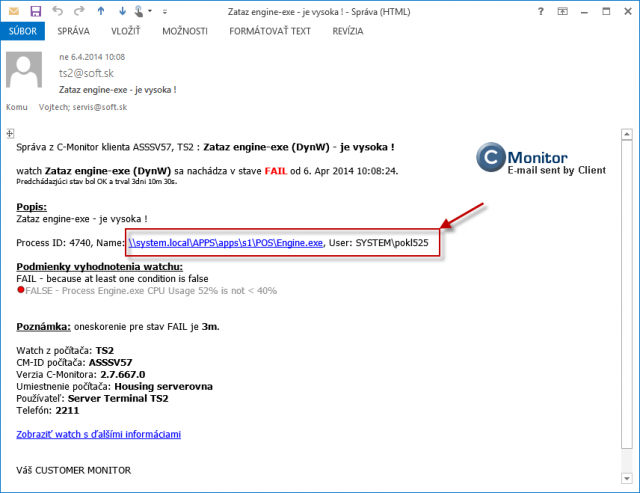
The mail notification about overload by the process, sent from C-Monitor, contains specific information about the user and exact storage of the application (this is important, if the given application is stored on several places - it will allow you to solve another overload operatively and without any delay (if you don't want to have that processed Killed after certain time, as we've described above).
