Network info
Network info
Network info offers detailed information about transferred data, which are counted every day anew. The transferred data are divided according to direction (upload, download), they're assigned to processes, with a particular IP address, and there are also displayed corresponding transfer ports to the transfers. Such detailed information cannot be found anywhere on CM Portal.
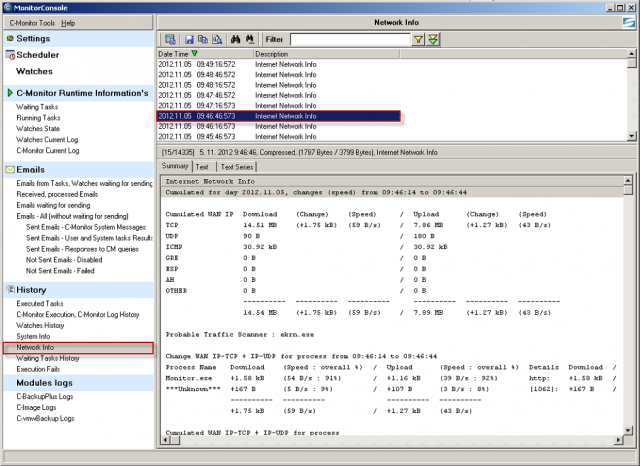
Entry to Network info is realized through C-Monitor tray icon. Open Scheduler - Monitor Console and in the new window select Network info from the options on the left, as displayed on the next image.

The output is divided to five parts.
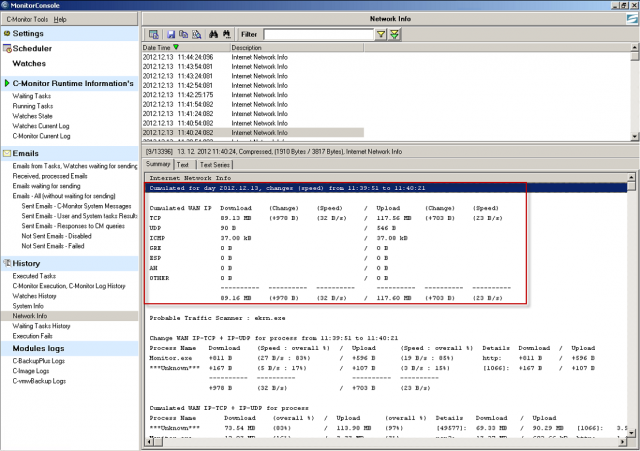
The first part shows cumulated amount of transferred data through individual protocols, counted from 00:00 till 24:00 of the current day. In the column Change are displayed changes for the past 30 seconds of received (download) and sent (upload) data, and in the column Speed is the average transfer speed. This section is highlighted on the next image.

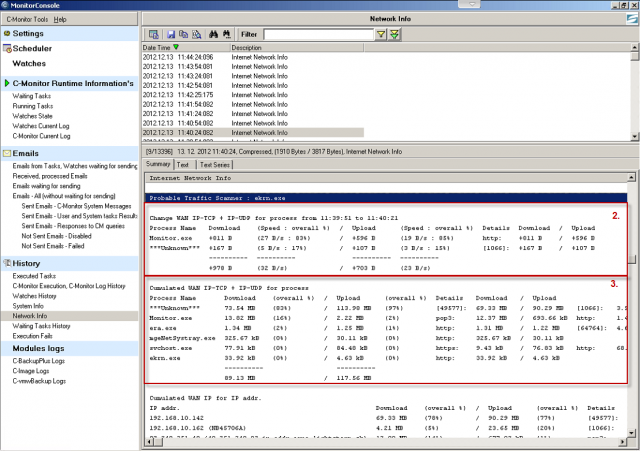
The second part shows the change of sent and received data for just TCP and UDP packets, for a concrete process for the past 30 seconds, with detail of transfer speed and transfer port.
The third part shows the same as the second one, but cumulative for the whole day (00:00 - 24:00).
The second and the third part are both highlighted on the next image.

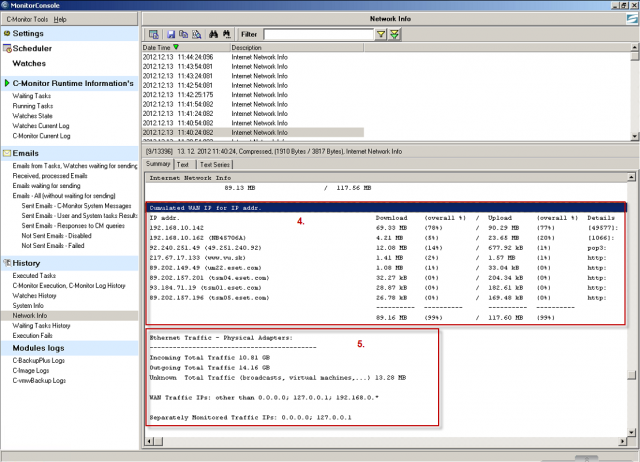
The fourth part shows cumulative amount of transferred data, distinguishing IP for the whole day from 00:00 till 24:00. It also shows average speeds of Upload and Download and transfer ports, and the percentage of the total data transferred.
The fifth part contains information about the whole traffic through virtual and network adapters.


