Watches states and logs
The main purpose of Watches in the solution Customer Monitor is to track values and states of IT system functions in real time, with notification of limit or erroneous values. Watches have a huge share on the main purpose of CM, which is to early and accurately determine errors, thus ensuring a smooth operation of computer equipment. Exact procedure of setup and description of the individual sections of Watches can be found in the section Introduction to setup of Online monitoring - Watches.
In this section we'll show you, where you can check the states of Watches, directly through C-MonitorConsole, but also through CM Portal, as well as view logs and history of the process of Watches.
View of the current state of Watch through C-Monitor client and CM Portal
States of set-up Watches may be viewed directly in the console, in the item Watches State, in the section C-Monitor Runtime Information, as is displayed on the following image
Description of columns of a Watch's current state:
Name/Short Name - name of the Watch and its abbreviation, a green circle means that the Watch is in state OK, red - Fail, gray - Unknown
Value - values that are evaluated by the Watch
State Evaluated - date and time of when the current state of the Watch was evaluated
Last State Change - the last change of the Watch's state
State Description - conditions to determine the state, which are evaluated along with the currently taken values

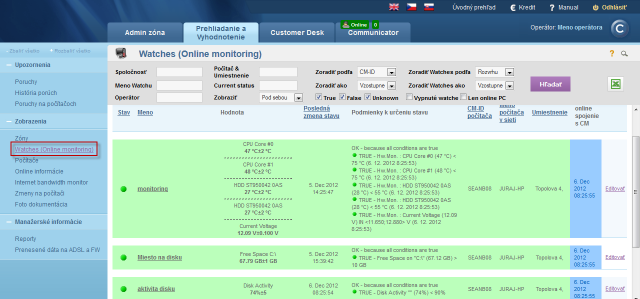
Information are transferred to CM portal with a few second delay, so you can also use the interface of CM portal to check states. States of Watches can be found at Presentation and Evaluation -> Presentation -> Watches(Online monitoring) -> search for a concrete Watch through the upper filter, as displayed on the next image. By pressing the button Edit, you can change evaluation parameters etc. By clicking on the Watch's Name, you'll get a view of the Watch's process history in a table or graphic form.

Current Log from Watches viewed via C-Monitor client
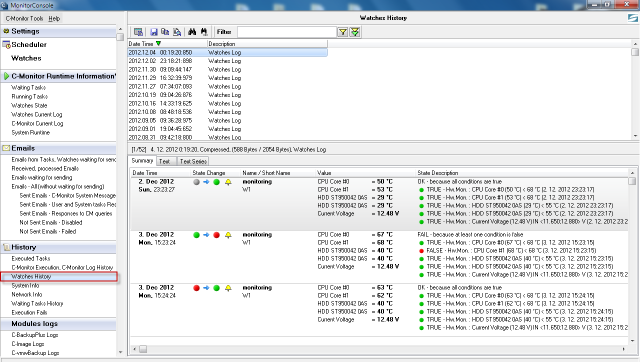
View of the current log from watches through C-Monitor client in MonitorConsole. Watches Current Log is displayed on the next image and it captures every change of the Watch's state.
Description of columns of a Watch's current state:
Date Time - ddate and time of when the change of the Watch's state occured
State change - captures changes of Watches' states
Name/Short Name - name of the Watch and its abbreviation, a green circle means that the Watch is in state OK, red - Fail, gray - Unknown
Value - values that are evaluated by the Watch
State Description - conditions to determine the state, which are evaluated along with the currently taken values

To view older logs, go to the section Watches History, as it's shown on the next image

Current Log from Watches viewed via CM portal
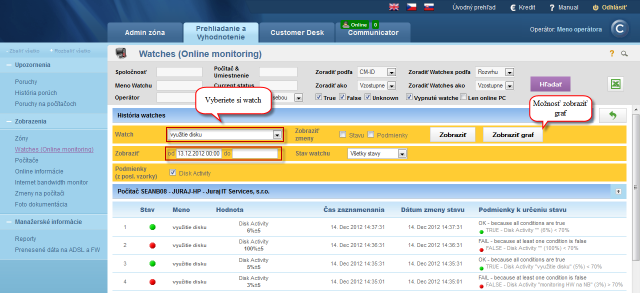
Log from watches can be viewed on CM portal in the section Presentation and Evaluation -> Watches (Online Monitoring) -> select a concrete watch through the upper filter and click on its name, as displayed on the following image.

In the next window, choose the time period for which you want the log from the Watch's process to be displayed. In case there's more Watches for the same device, select one whose history you want to view, and press the button Show. By clicking on the button Show graph, you'll also see the Watch's course history as a graph.


