Breakdown according to applications (so far only up to WIN7/2008)
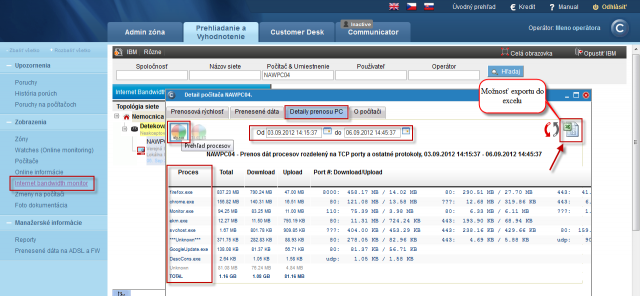
To view transferred data according to applications, enter the Internet bandwidth monitor in the section Presentation and Evaluation -> Presentation -> Internet bandwidth monitor, select the customer, for whom you want to display the overview, using the upper filter. In the left part, you'll see the whole network topology including all specific devices. If you want to view the overview of transferred data according to applications for a specific PC, then click on this PC in the topology on the left side, which will automatically open a new window, in which there's a tab Details of PC transfer, in which you can click on the link to view Overview of processes, as you can see on the next image.

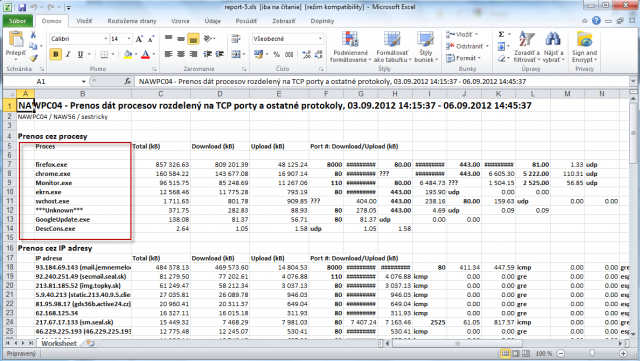
This overview can also be exported into Excel, the export is illustrated on the next image.

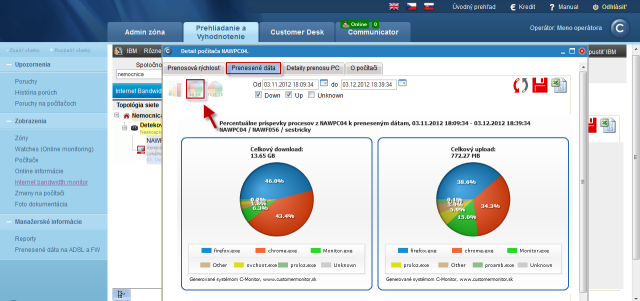
In the tab Transferred data, you can view percentage contribution of particular processes to the transferred data, as displayed on the following image.

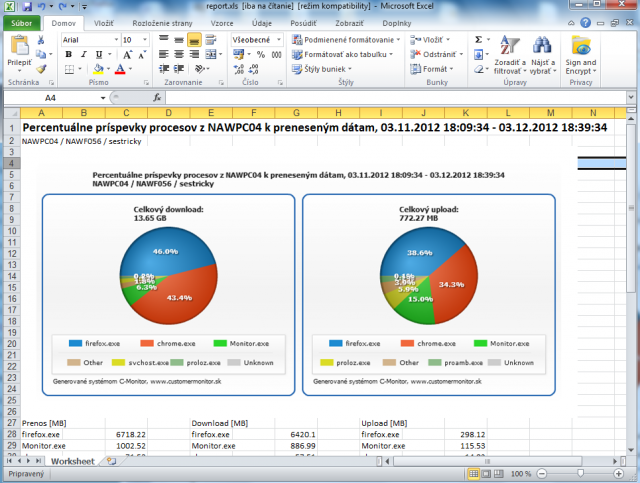
This graph can also be exported into Excel, the export is displayed on the next image. In the export, there's total upload and download of each process written under the graph.


