C-Monitor WIN client for version 2.8
We release Windows client for the CM Server version 2.8
The package C-Monitor 2.8.690.0 contains the following fixes and improvements:
- New Watches templates
- Internet Bandwidth Monitor for WIN 8,2012, conflict-free version for WIN7
- Admin authorization to perform C-Monitor client registration executed under a regular user
- View of top applications and IP addresses burdening the internet directly in the Info-panel
- Instant designation of which process most burdens the drive, directly in the Info-panel
- Historic overview, which processes most loaded the drive
- Unveiled meaning of svchost.exe and similar processes
New Watches templates:
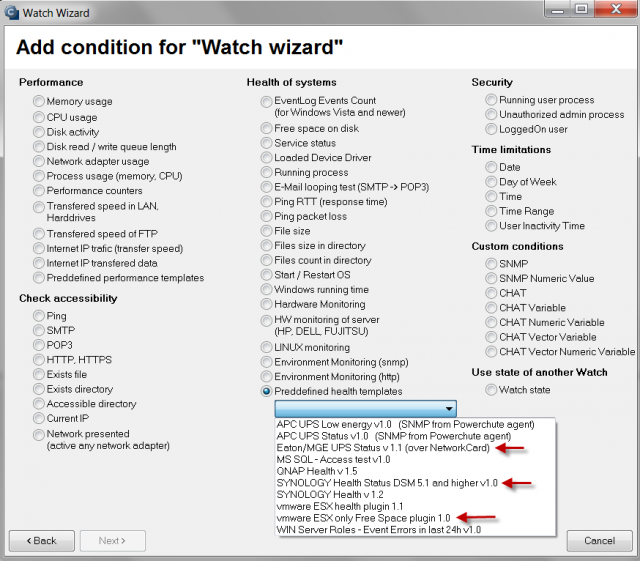
EATON/MGE UPS Status v 1.1 – new template, which is used for status monitoring of a UPS station (input voltage, remaining battery capacity, load)
VMware/ESX Datastore – new template, solely used to check availability and free space status on partitions vmware 5.x and higher (with no further information).
Synology health DSM 5.1 and higher v1.3 – new template for Synology with system DSM 5.1 and higher. This version has system partitions already separated during the check of free space. System partitions usually have just a few hundred MB and they used to cause problems at evaluation of free space status together with other partitions.
Internet Bandwidth Monitor for WIN 8,2012, conflict-free version for WIN7:
IBM now works with operating systems Microsoft Windows 8 and higher, 2012, 2012R2. We've applied the new system of data reading for Windows 7 as well, by which we've removed the potentially conflicting driver (MicroOLAP), which has so far been used to determine the volume of data transferred to internet locations.
Admin authorization to perform C-Monitor client registration executed under a regular user:
When installing C-Monitor client under a user without admin permissions, after the base part, you've encountered a dialog to enter admin name and password, so that the registration can be executed. Acceptation of admin name in this dialog has been adjusted also for the regular format DOMAIN\user , not just the format "user@DOMAIN".
View of top applications and IP addresses burdening the internet directly in the Info-panel:
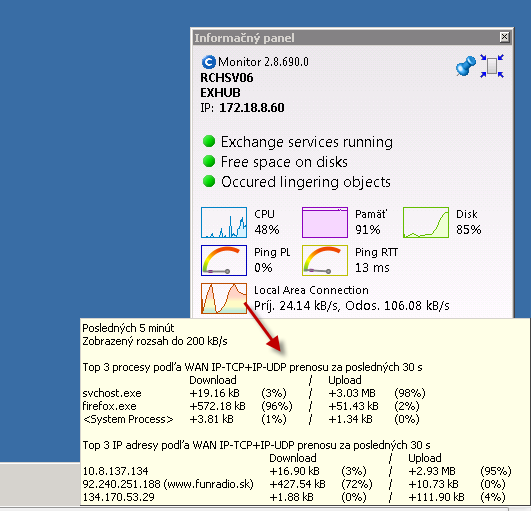
If an admin or a user wants to find out what's currently burdening the computer he is operating, he no longer needs to login to CM portal (online information, resp. all details in the separate section IBM), or browse the information through C-MonitorConsole (from the left menu Network info). It is now sufficient to just open the Information panel from the C-Monitor client icon by hovering over the C-icon and get the cursor over any graph showing network load of the adapter. This will show 5 top applications and the
Warning: The computer must have monitoring of internet transfers enabled in the C-Monitor settings (via CM Portal)
Instant designation, which process most burdens the drive, directly in the Info-panel:
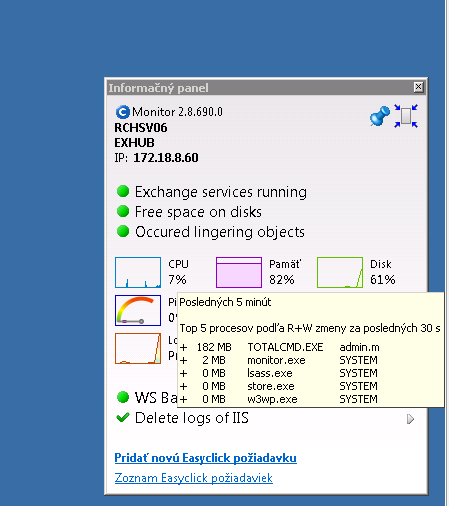
Similarly to the previous case, get the cursor over the graph for disk load in the information panel, and a tooltip window will show, which contains a list of applications that had the largest transfers with the disk system (Read+Write) for the past 30sec.
Additional information: This information cannot be found on CM portal yet.
Historic overview, which processes most loaded the drive:
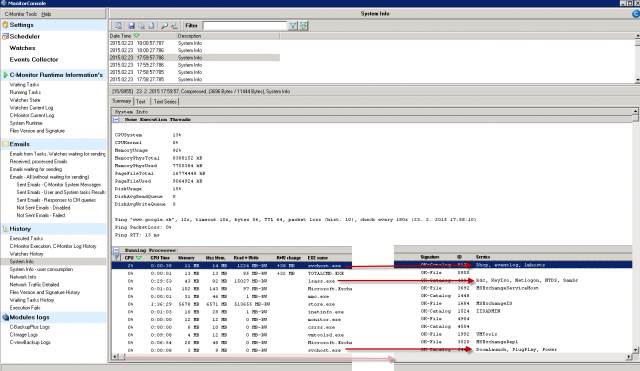
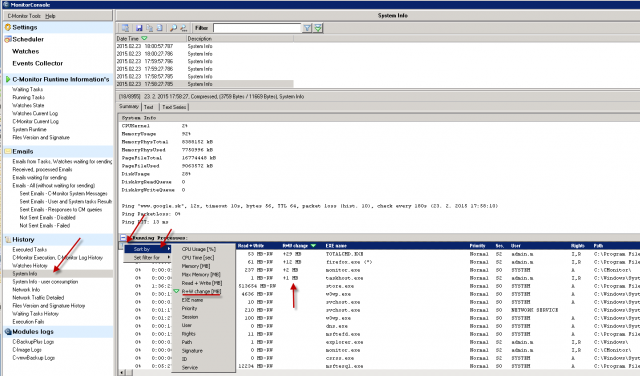
Open directly on the computer C-MonitorConsole -> SystemInfo, search the sample (time) in the top right corner of the screen, and sort the process output according to R+W change. This way you can get a quick overview of processes, which most burdened the drive at that time.
Unveiled meaning of svchost.exe and similar processes:
It often occurs to adminitrators, that they encounter the system process svchost.exe or lssas.exe, or another one, which represents one or more services. To find out which service is hidden behind this process, you would need an additional application. With C-Monitor 2.8. it is no longer necessary, designation along with archivation for a few days back is secured from this version onwards. You can get to the details of the processes svchost.exe, lsass.exe through C-MonitorConsole on the computer, in the section System info.
After searching/filtering/selecting a certain time sample, find svchost.exe and continue by moving right in the bottom window, until you get to the column "Service". Here is a list of services bound to the given system process.
